Common Search Analytics Reports | Yext Hitchhikers Platform
Overview
This article walks through some common examples of Search reports you may build in Report Builder. Feel free to take these as a starting point and customize to your needs. Here are some examples of ways you can customize these reports:
- Switch out the metrics in the examples below with other metrics.
- Set a dimension if you’d like to see how metrics compare across different geographies, device types, or sources, for example.
- Set the same items as filters if you’d like to dive deeper into certain demographics.
- Change the chart type depending on your visual preference.
Generally, you should add the following filters in your Search reports:
- Configuration Version Label: Production - Exclude searches run in staging where you may run various searches to QA the experience.
- Traffic Source: External - Exclude searches run by internal traffic, such as your employees or Yext employees and/or agencies working on your behalf. Learn how to set “Internal Traffic” in the Internal Traffic Type reference doc.
For a full list of Search metrics, check out the Search Metrics reference doc.
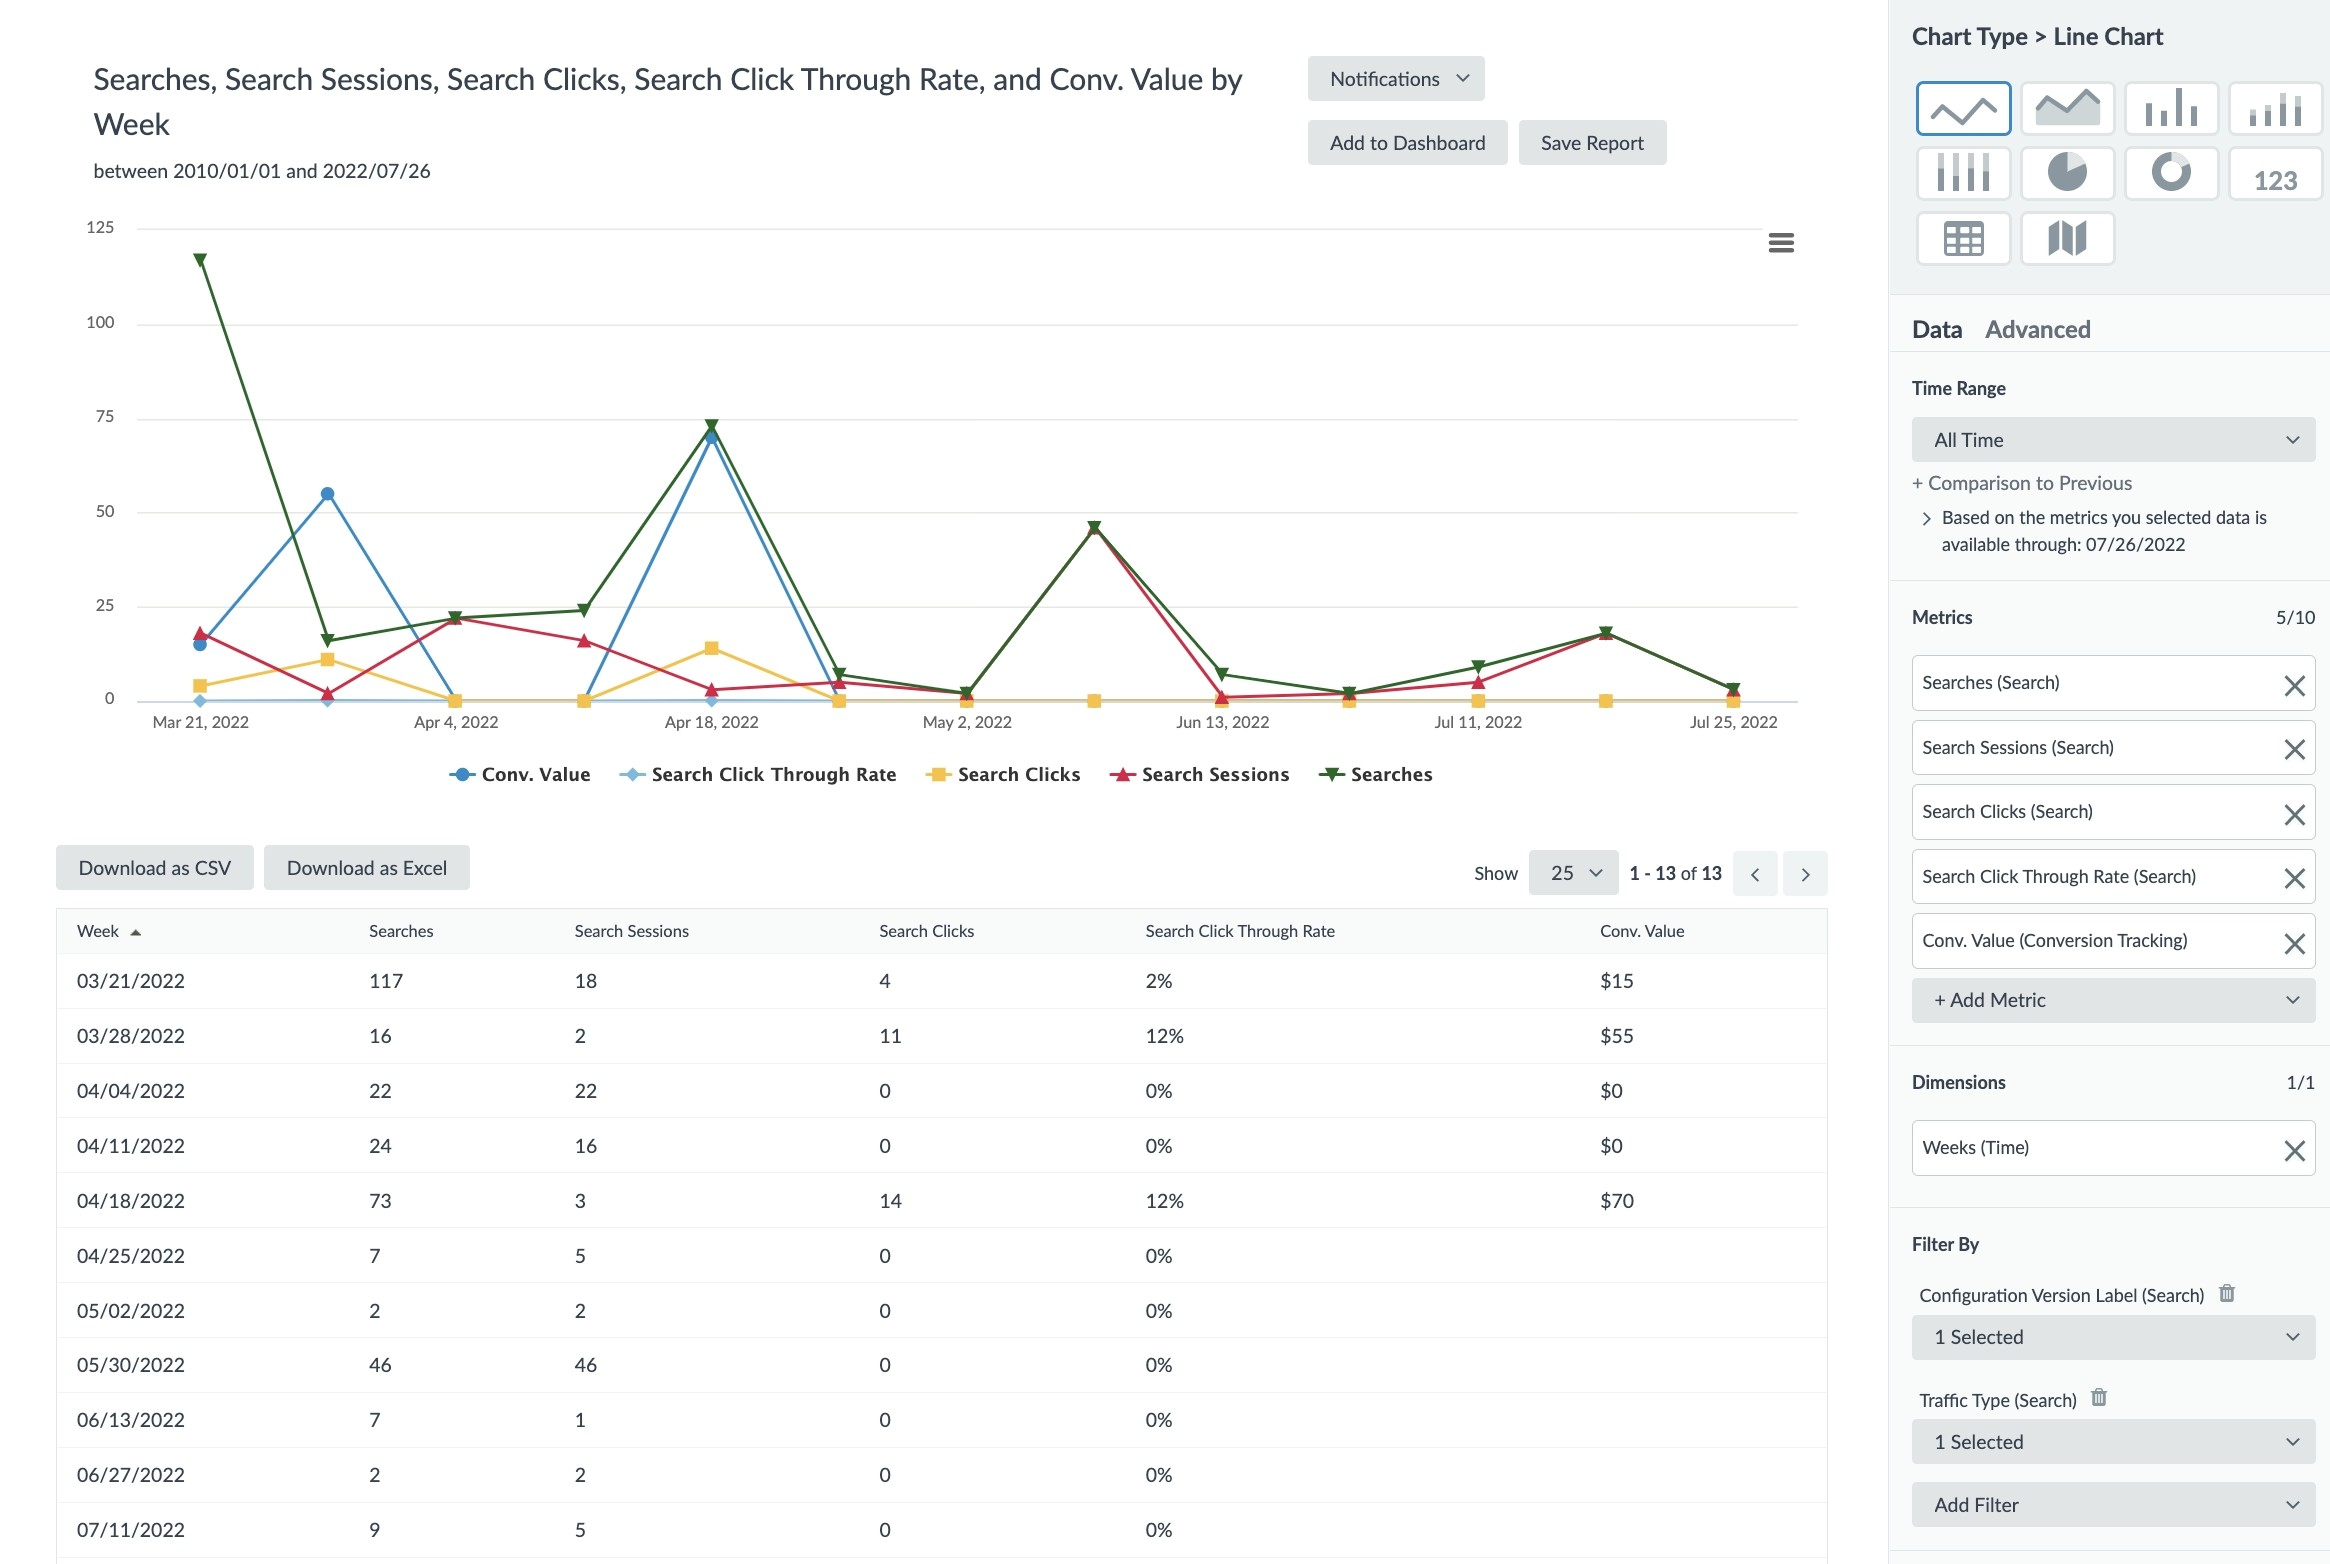
Metric Trends Over Time
Once you have been live for a few weeks, you’ll want to analyze trends in your Search experience over time. One way to do that is to create a week over week comparison of key metrics (you can also dimension time by days, but this shows weekly patterns rather than daily fluctuations). Note the start of the week is set to Mondays by default.
To set up this report:
- Chart Type: Line Chart (for a visual representation) or Table Chart
- Metrics: Searches, Search Sessions, Search Clicks, Search Click Through Rate, Conversion Value
- Dimensions: Weeks
- Filters: Configuration Version Label: Production, Traffic Type: External
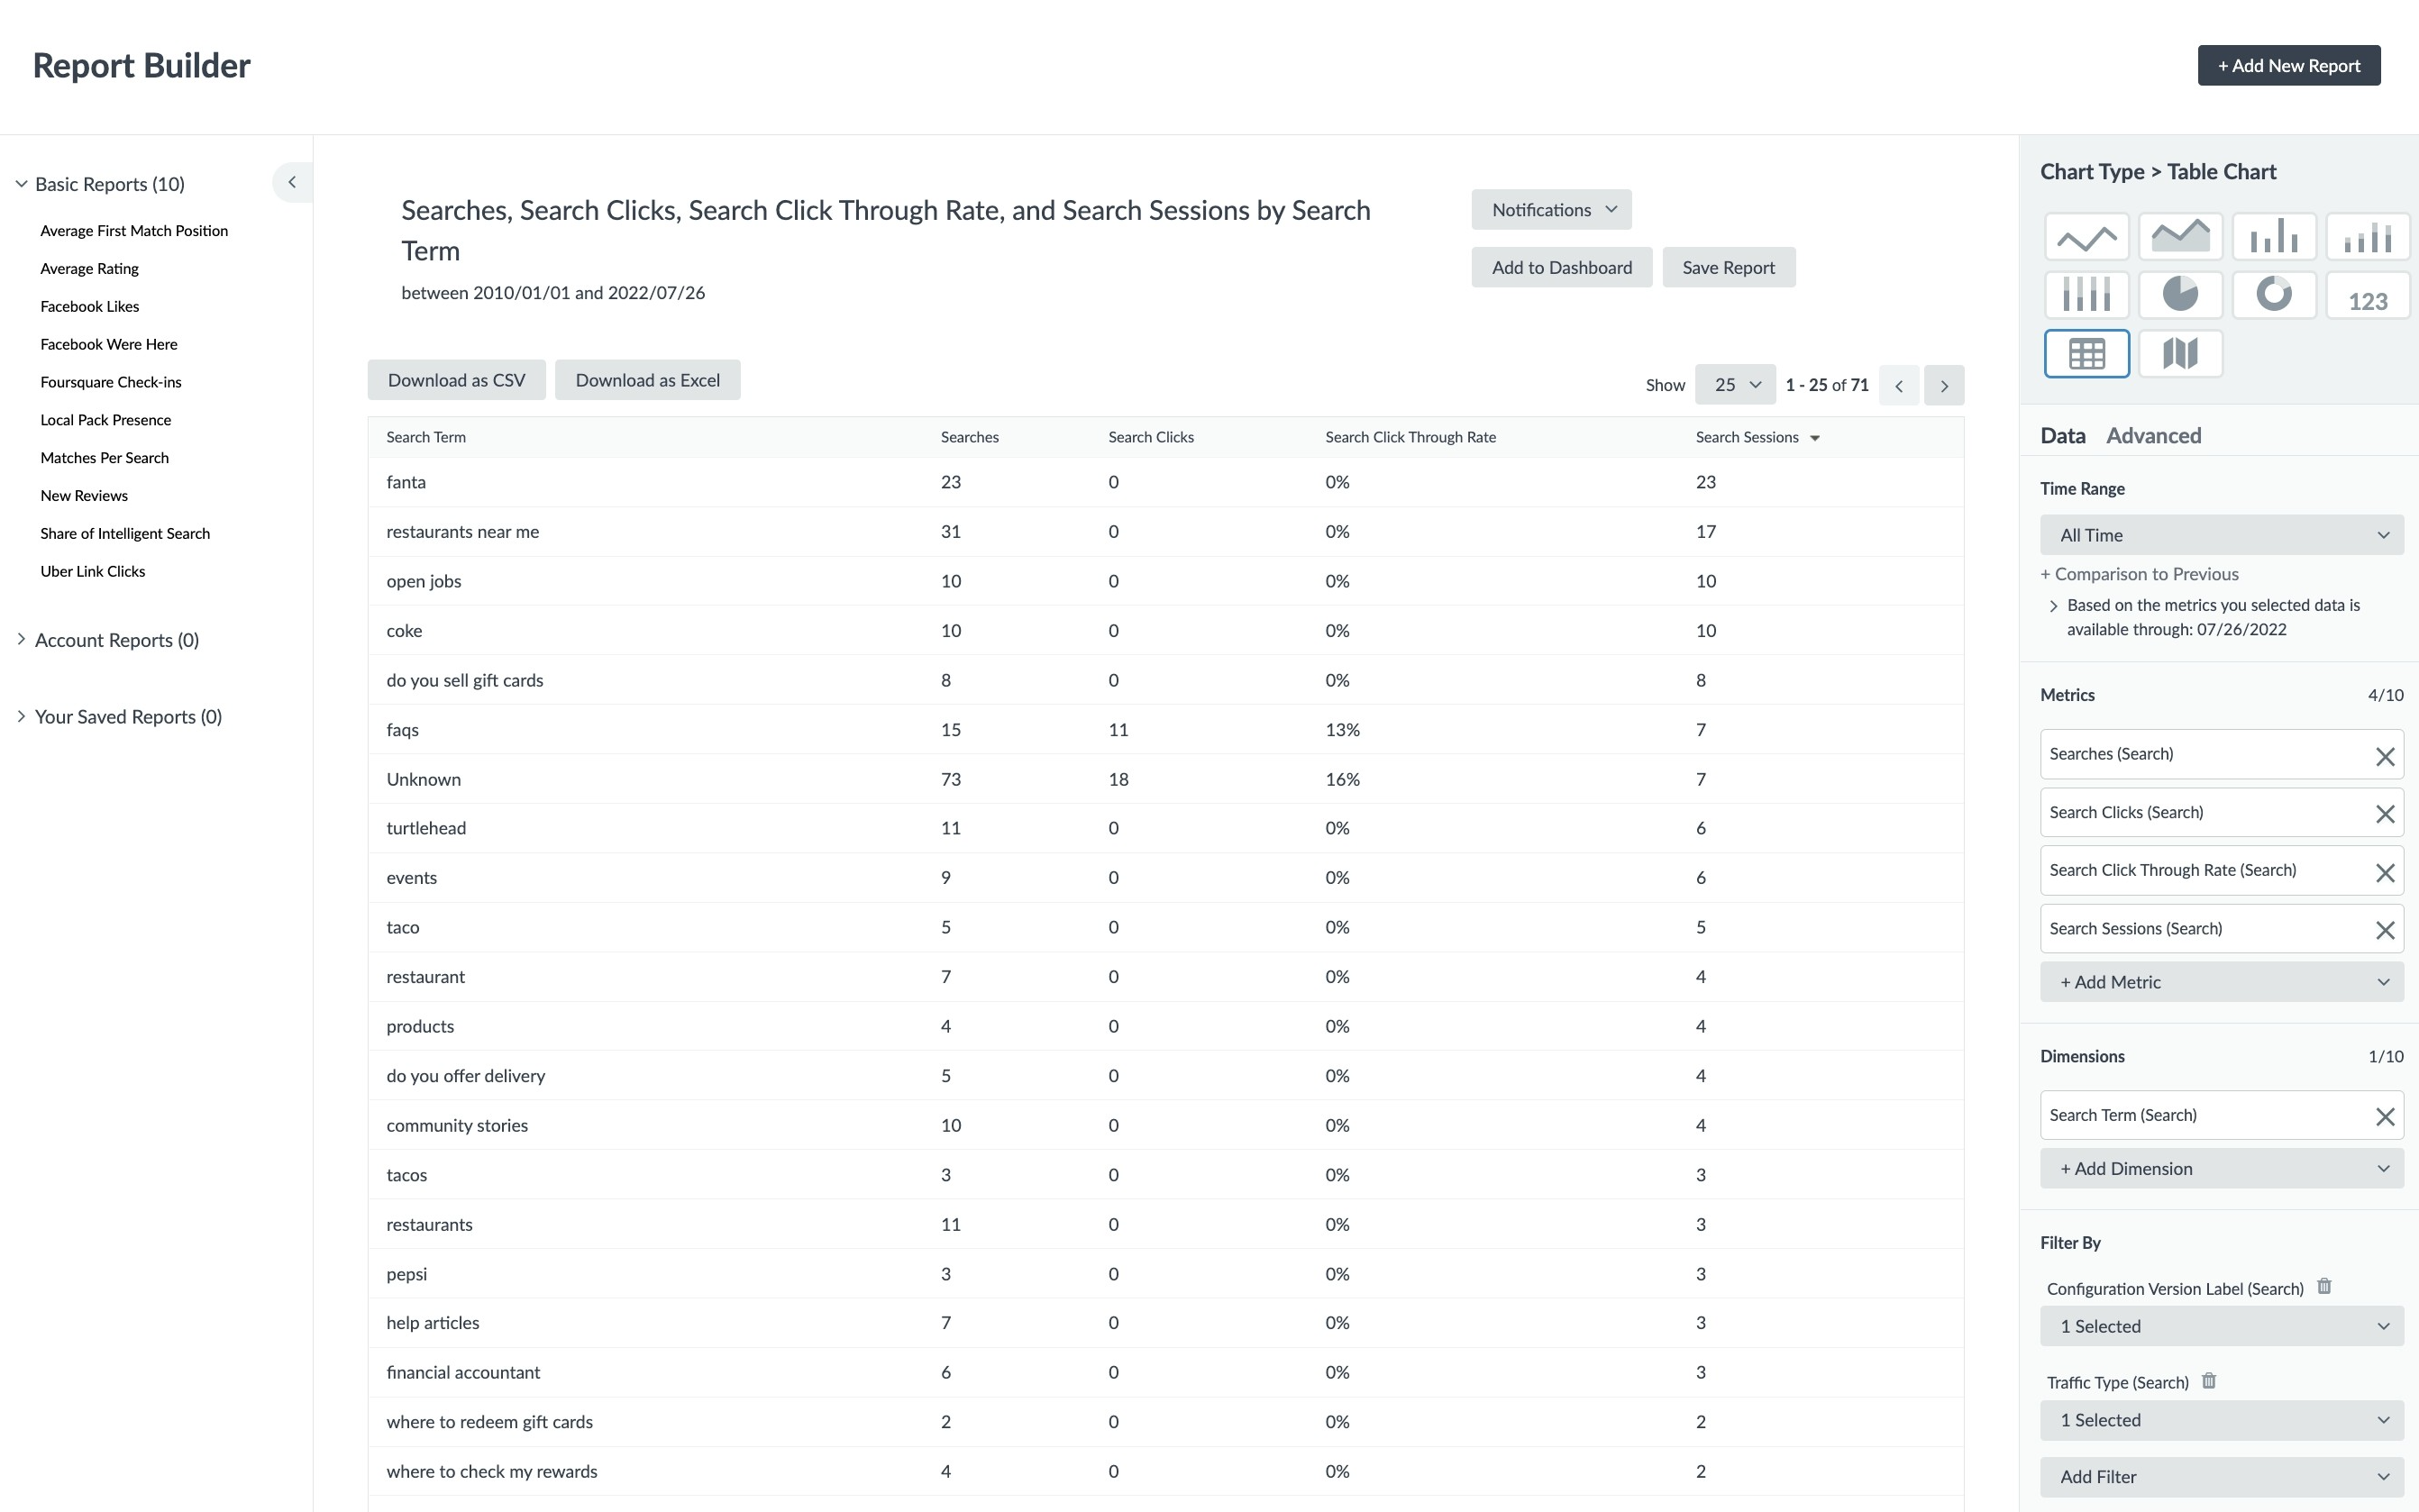
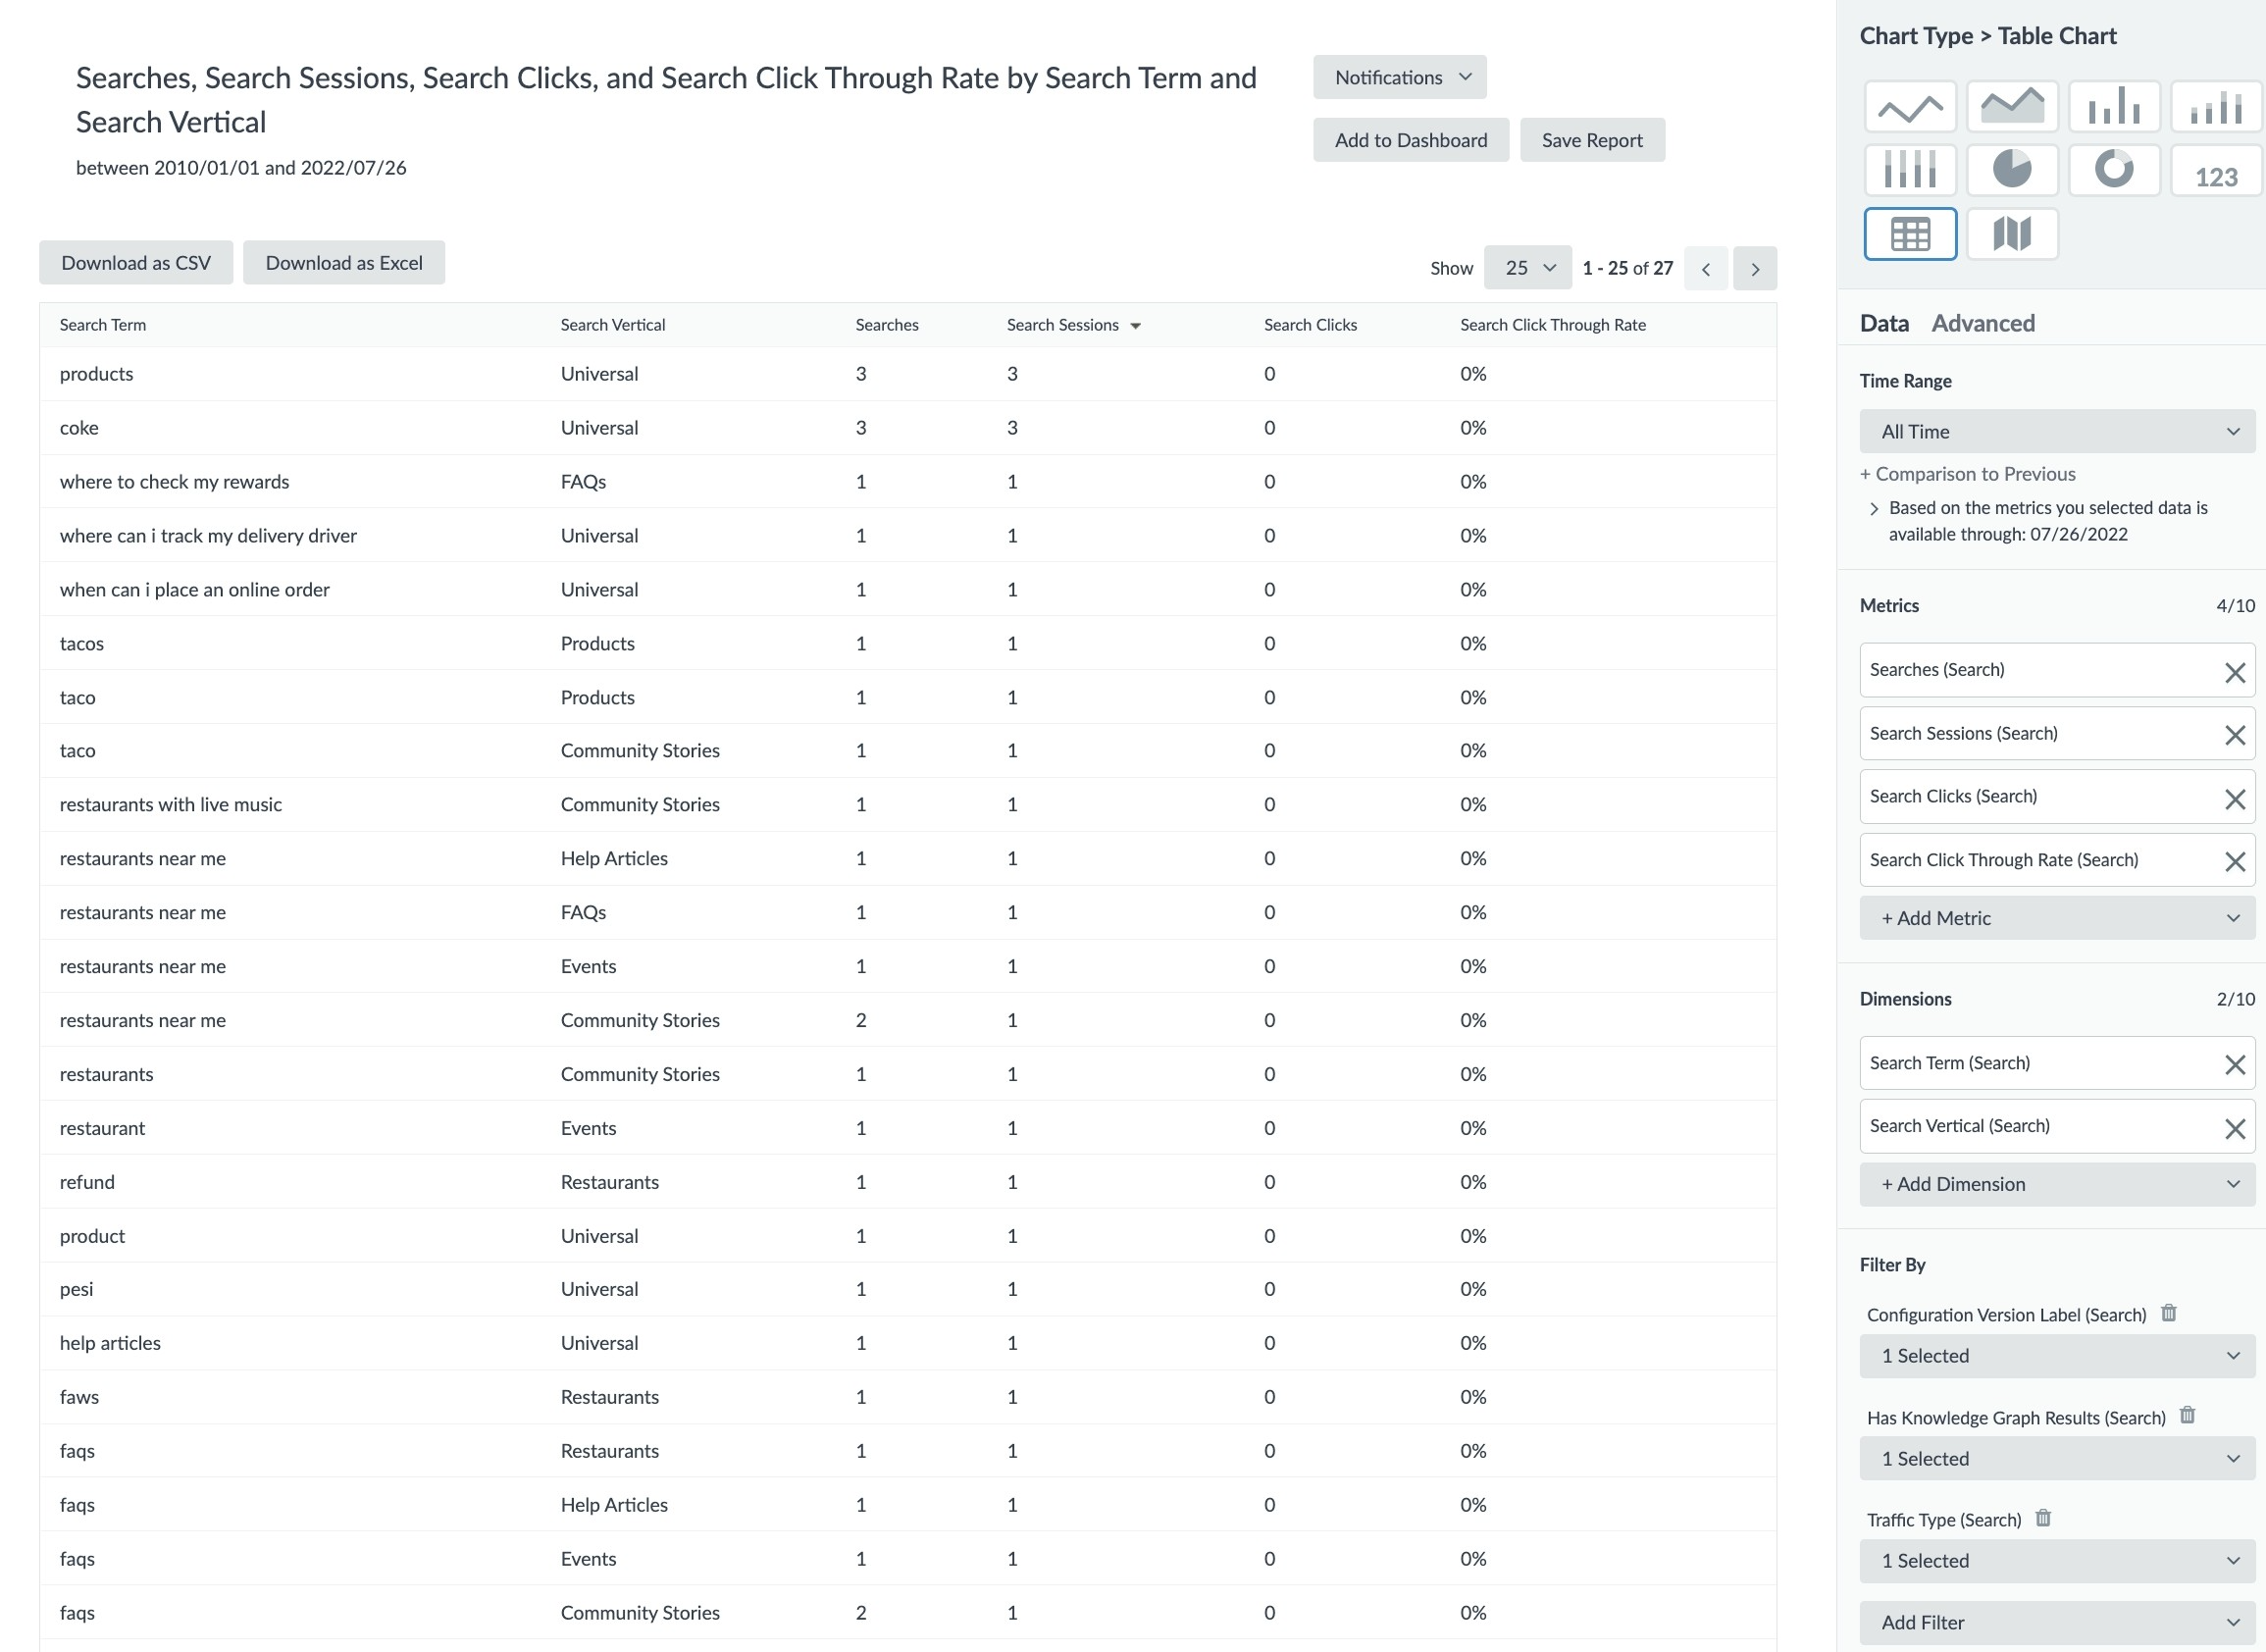
Top Search Terms
One key insight to your Search experience is knowing what users are searching for the most to understand if your content meets the needs of users.
To set up this report:
- Chart Type: Table Chart
- Metrics: Searches, Search Sessions, Search Clicks, Search Click Through Rate
- Dimensions: Search Term
- Filters: Configuration Version Label: Production, Traffic Type: External
- Sort: Search Sessions: Descending
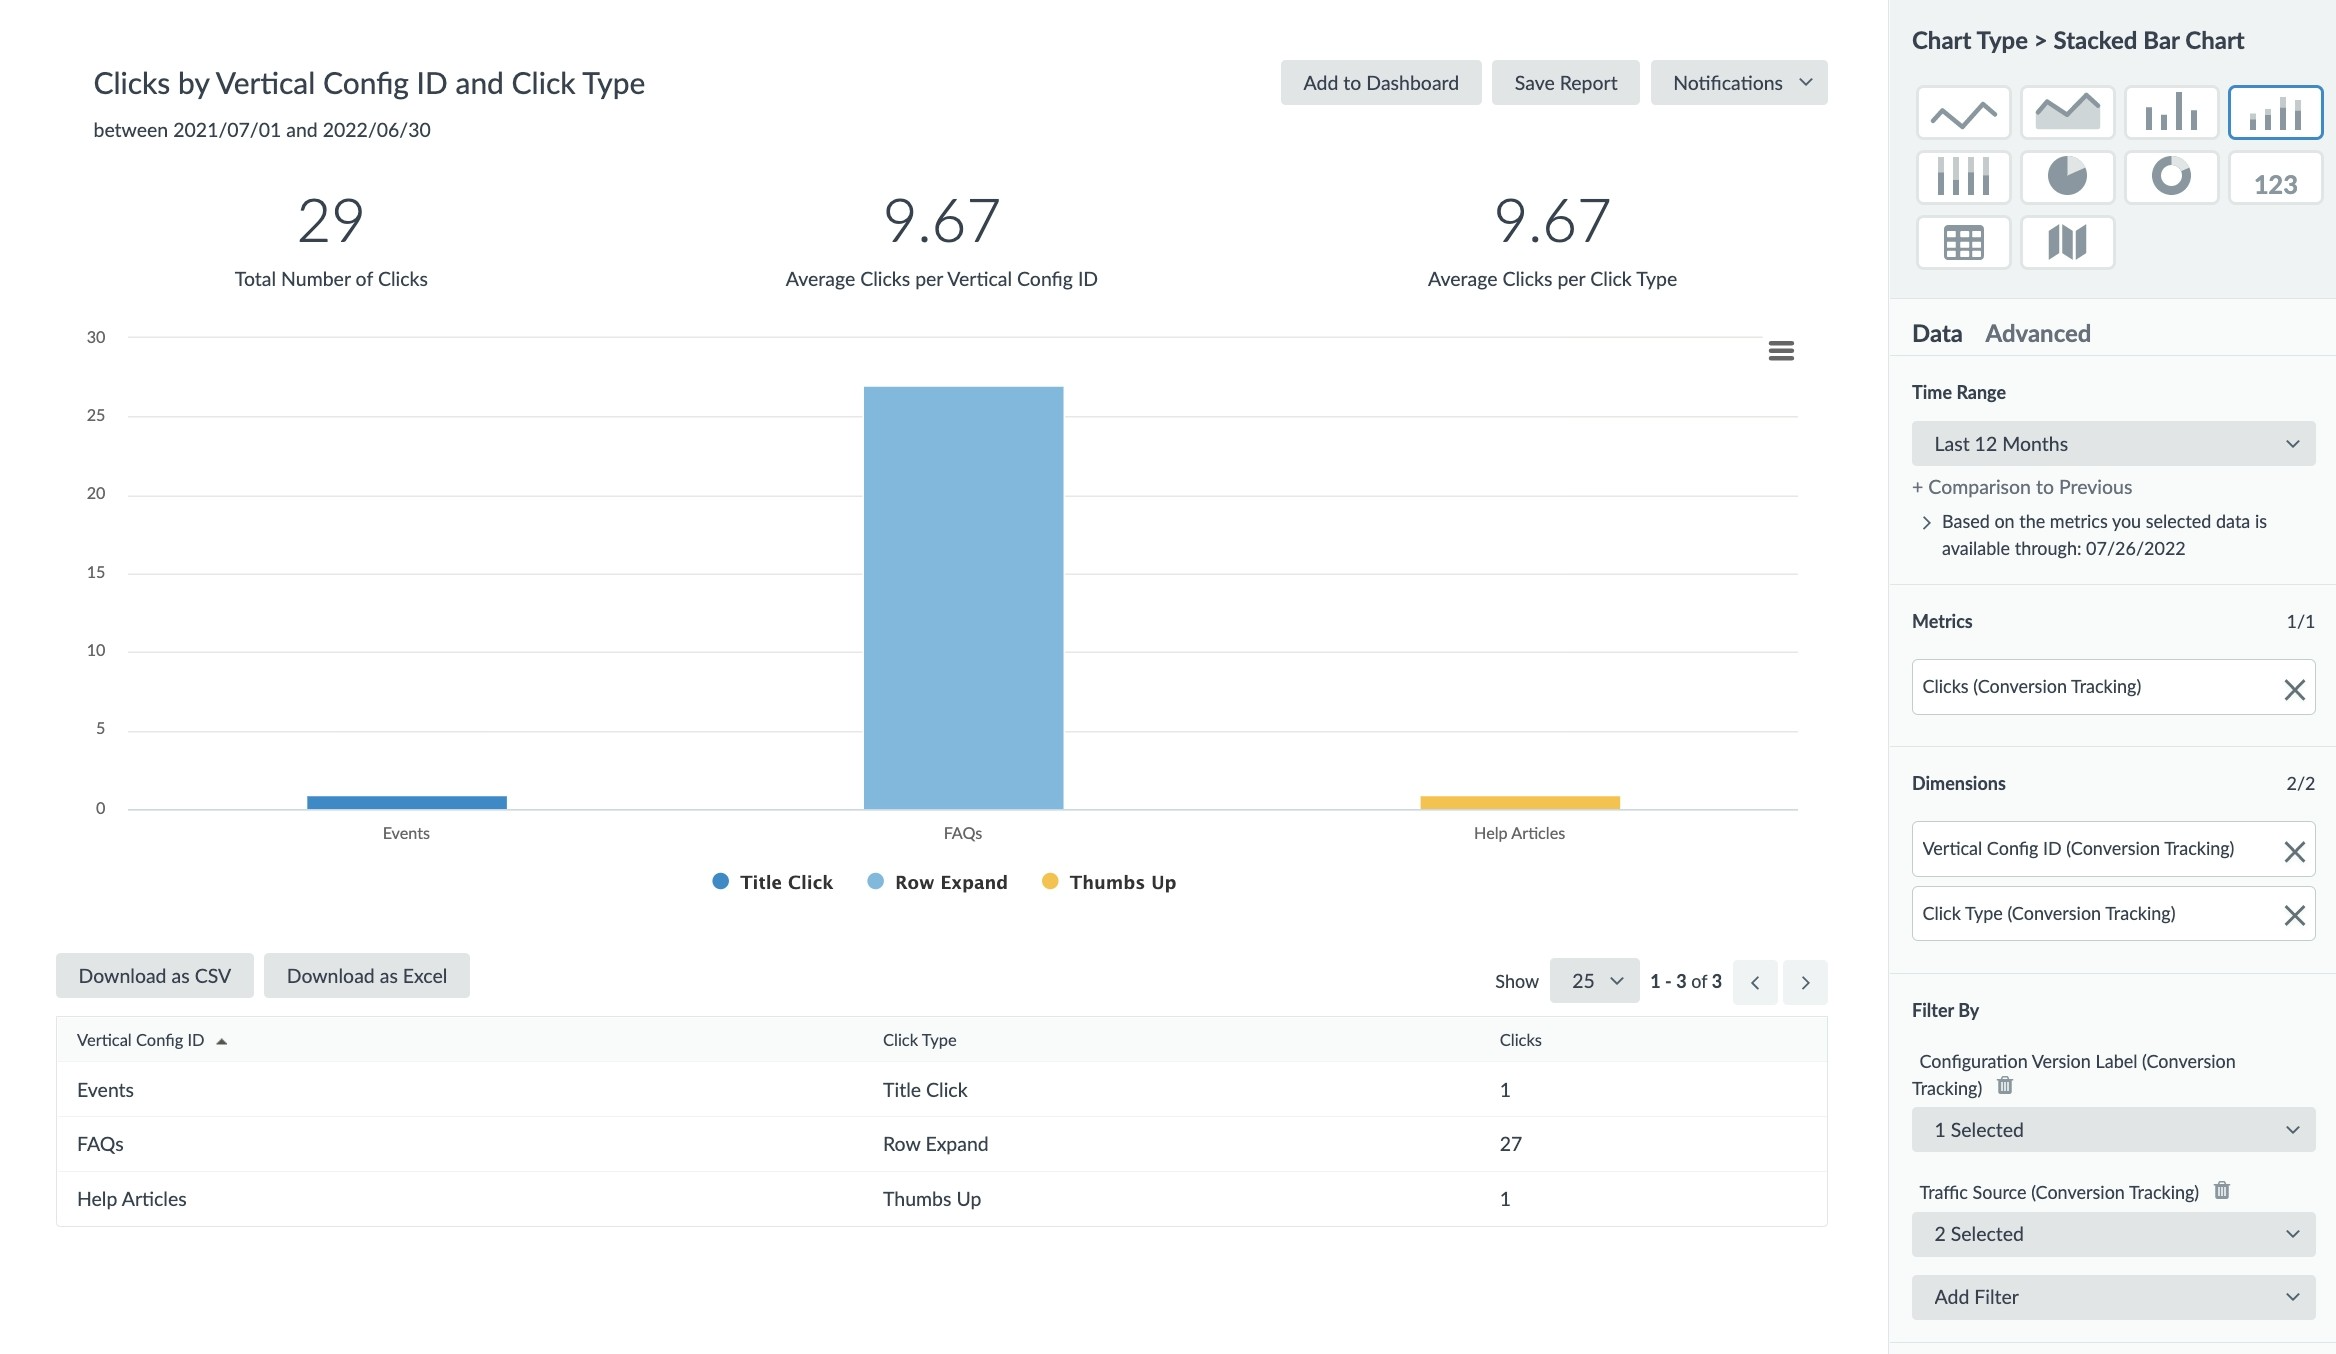
Clicks by Entity Type and Click Type
Once you know what users are searching for, you’ll want to take a look at what content on your site users are engaging with. We can demonstrate this by showing what entity types users are clicking on and which parts of the entity results cards users are clicking on specifically. Learn more about click types in the Search Analytics Event Types reference doc.
To set up this report:
- Chart Type: Stacked Bar Chart (to compare across entity types) or 100% Stacked Bar Chart (to hone in one the breakdown within each entity type)
- Metrics: Clicks
- Dimensions: Vertical Config ID, Click Type
- Filters: Configuration Version Label: Production, Traffic Source: External
Search Terms with No Results
When determining what improvements can be made to your Search experience, you’ll want to review search terms without results. From here, you can decide whether and how to address these search queries. Review the Search Optimizations unit for types of optimizations you can make based on search term behavior.
To set up this report:
- Chart Type: Table Chart
- Metrics: Searches, Search Sessions, Search Clicks, Search Click Through Rate
- Dimensions: Search Term, Search Vertical (no results for a specific query on a specific vertical may be expected behavior)
- Filters: Has Results: No, Configuration Version Label: Production, Traffic Type: External
- Sort: Search Sessions: Descending
Note that if a search term is included in this report, it does not necessarily mean every search with that search term returned no results during this timeframe. For example, perhaps you added content to address the search term partway through the timeframe. As an additional example, searches based on geolocation (e.g. “locations near me”) may return no results if there are no locations near the user.
Other Examples for Search in Report Builder
As we continue to expand the set of dimensions and filters available to analyze Search data, you’ll have more flexibility to customize reports to answer your brand’s questions about what content your users are searching for and engaging with:
- Set a dimension if you’d like to see how metrics compare across different geographies, device types, or sources, for example.
- Set the same items as filters if you’d like to dive deeper into certain demographics.
The following are examples of how you can apply different dimensions to your Search reports. Again, we encourage you to take these as a starting point and explore on your own!
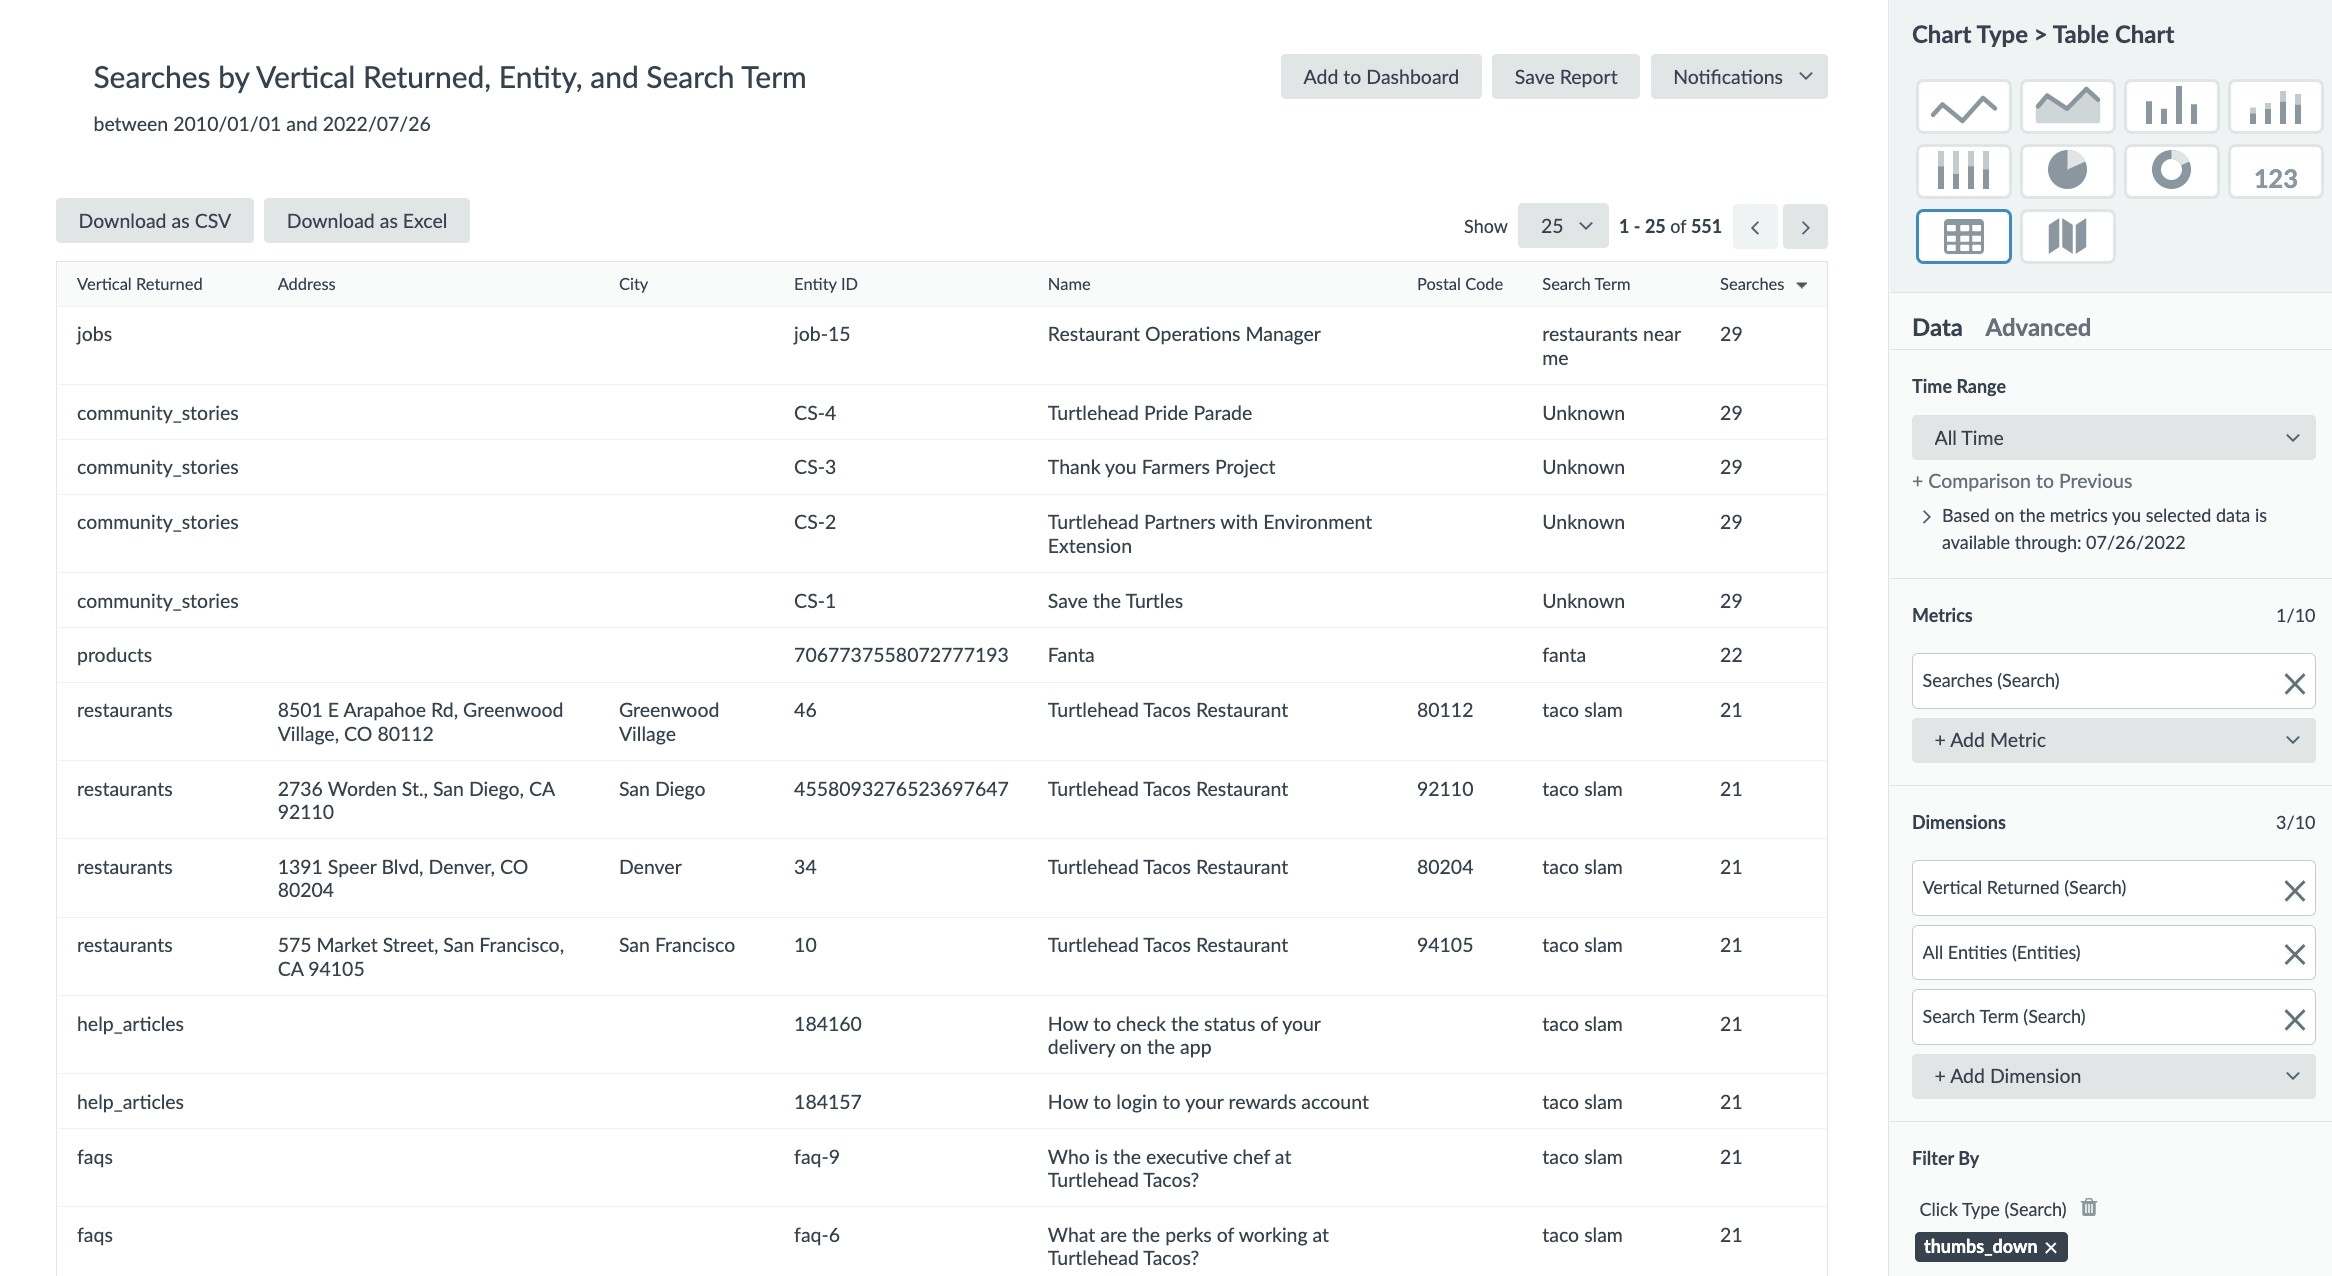
Feedback on Results by Search Term
With the ability to add thumbs up/thumbs down buttons on all entity cards, you need a place to consolidate that feedback and make it actionable. Filter down to thumbs down clicks to see which entities in search results users don’t want to see for particular search terms.
- Chart Type: Table Chart
- Metrics: Searches
- Dimensions: Search Term, All Entities, Verticals Returned
- Filters: Click Type: THUMBS_DOWN, Configuration Version Label: Production, Traffic Type: External
- Sort: Searches: Descending
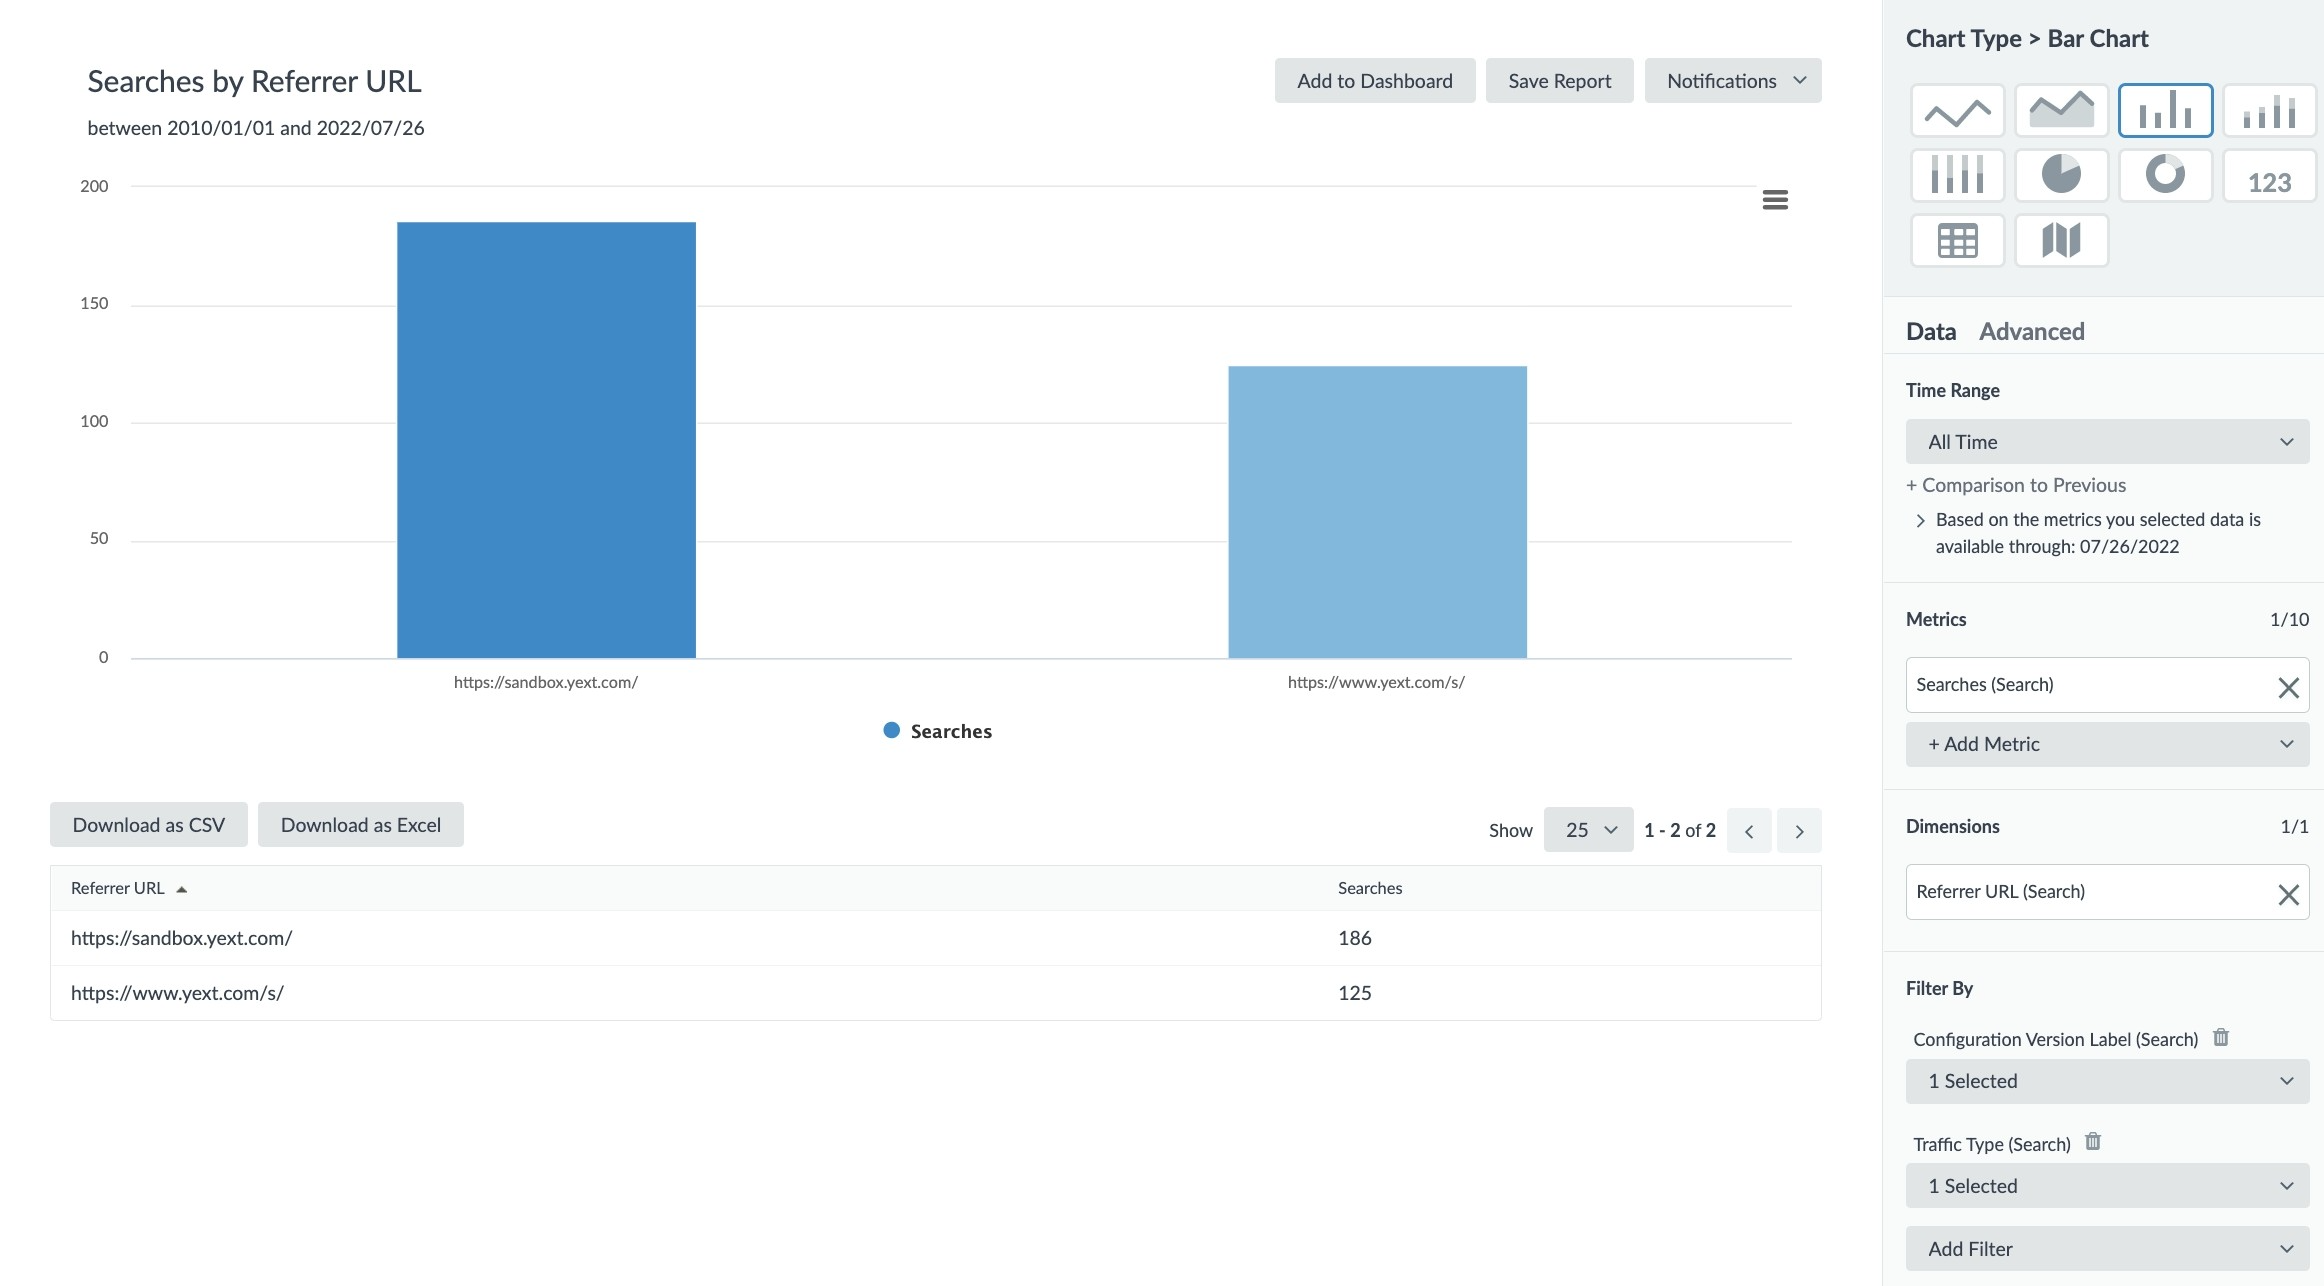
Metrics by Referrer URL or Referrer Domain
Knowing what users are searching for and engaging with is helpful, but where are they coming from? What pages are users on when they decide to use site search? If you have placed the search bar or links to the Search experience across your website and on different domains, you can take a look at how users found the Search experience.
- Chart Type: Table Chart, Bar Chart, or Pie Chart, depending on your visual preference
- Metrics: Searches
- Dimensions: Referrer URL or Referrer Domain for a summarized version
- Filters: Configuration Version Label: Production, Traffic Type: External
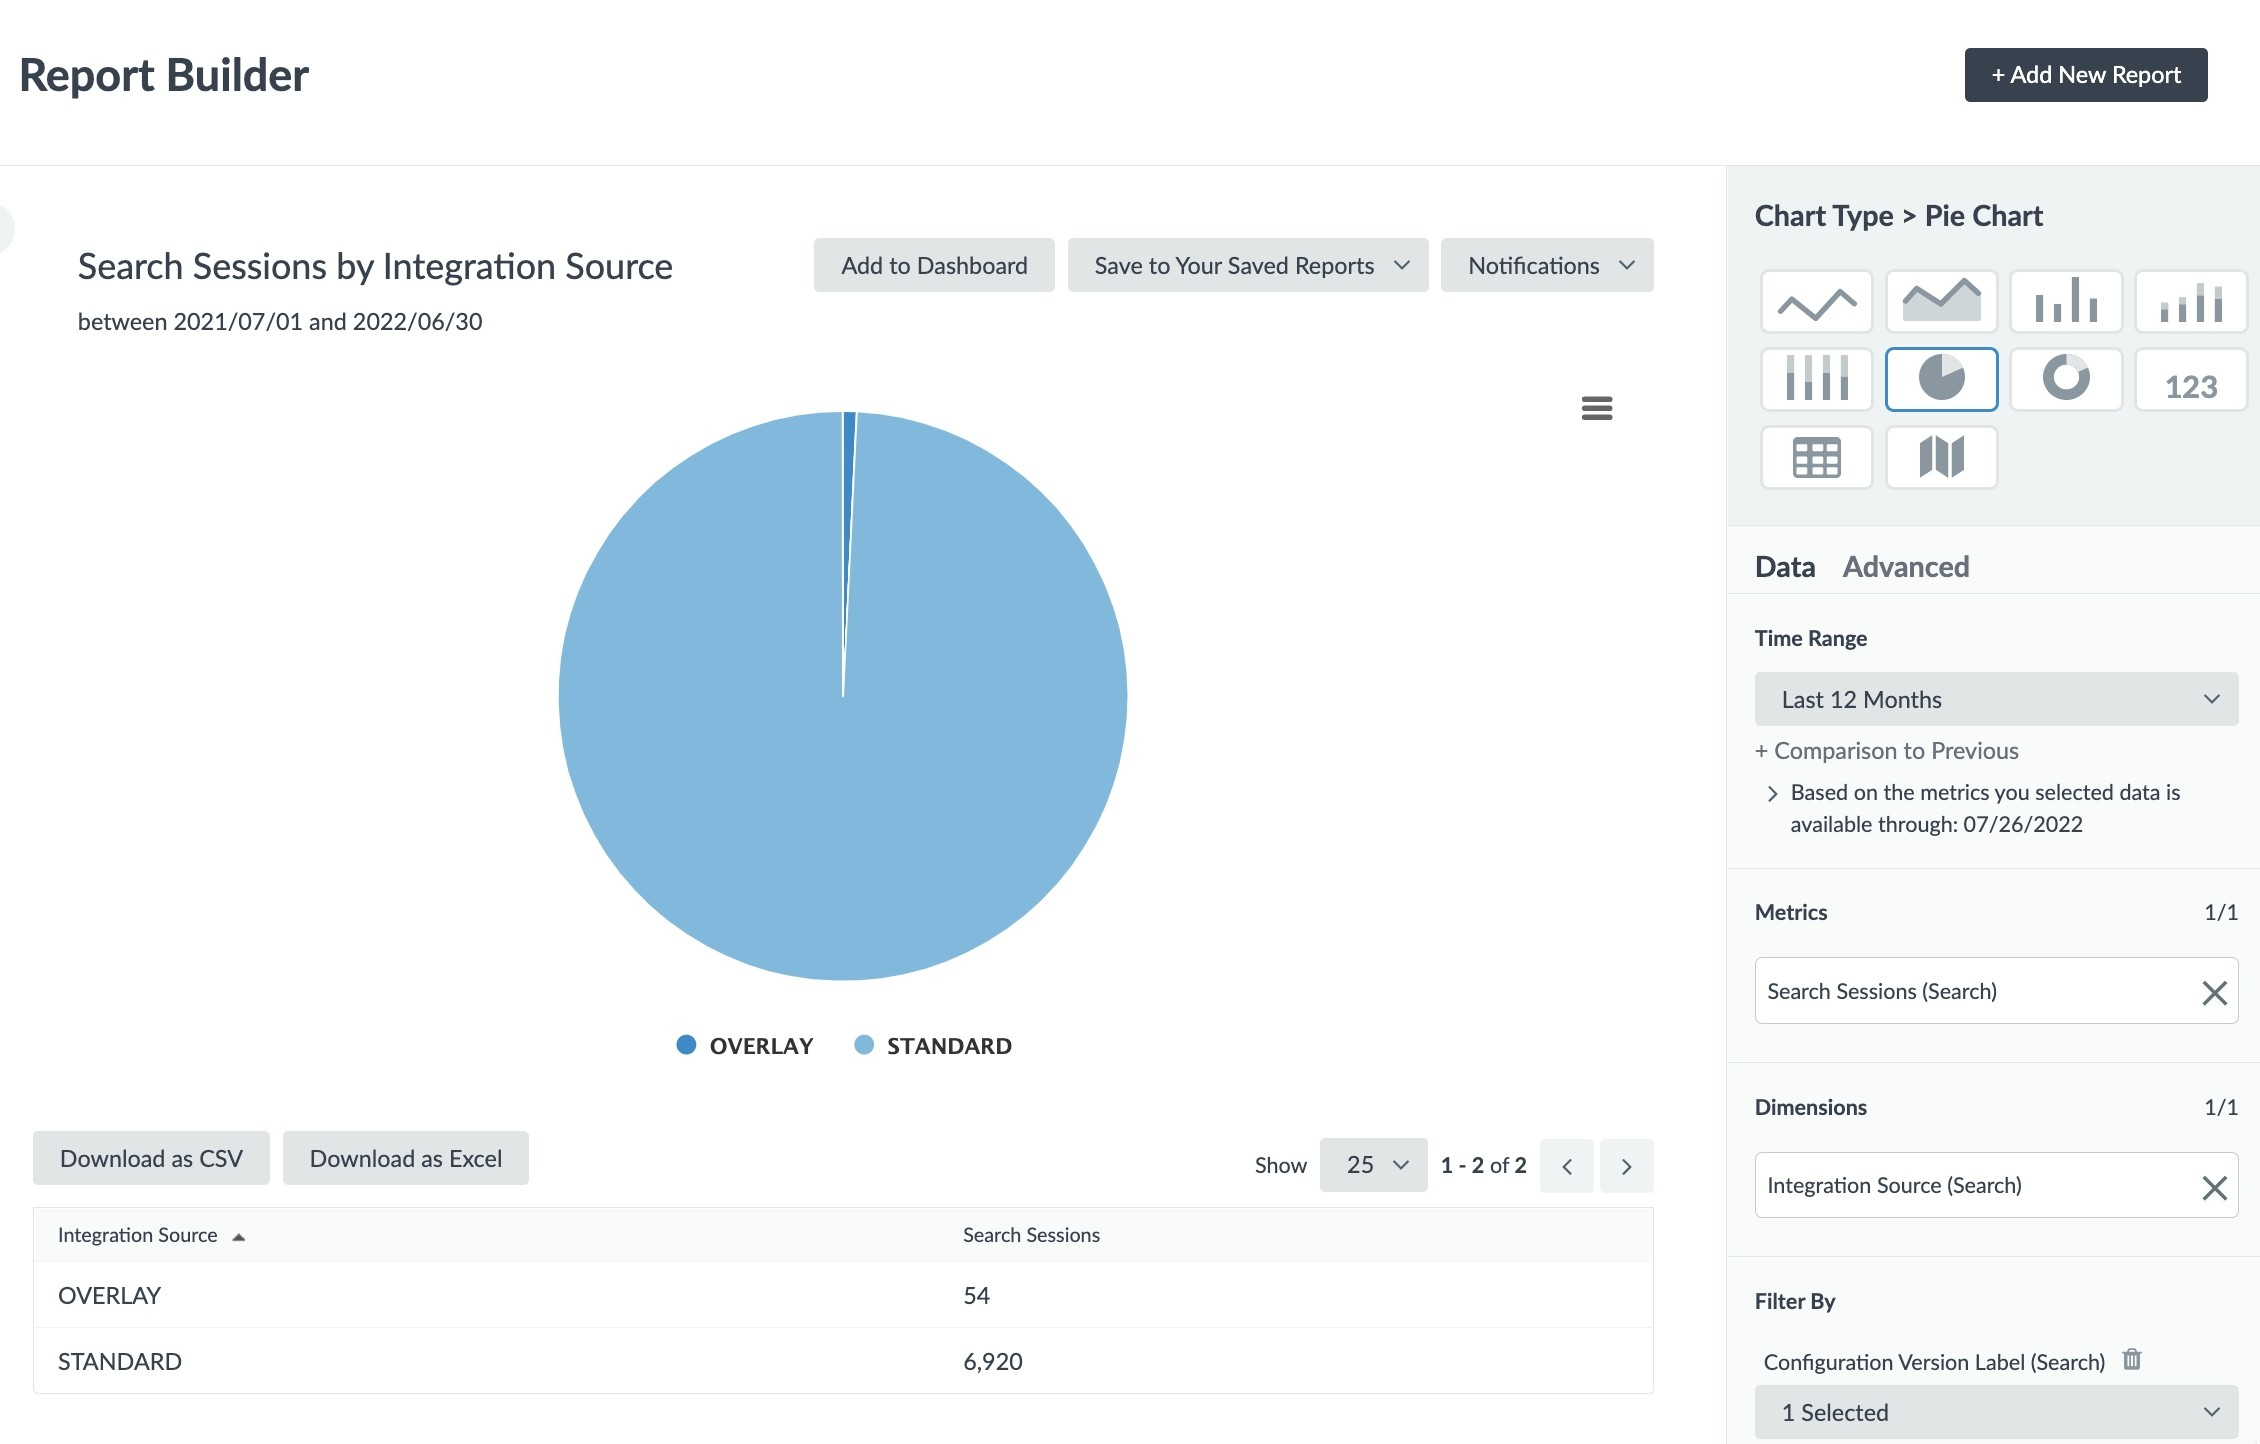
Metrics by Integration Source
If you have installed the overlay integration method, you might want to know which user interface is preferred. Are users searching or clicking more often through one integration method over the other? To do this, you can dimension Search metrics on the integration source.
- Chart Type: Table Chart, Bar Chart, or Pie Chart, depending on your visual preference
- Metrics: Search Sessions
- Dimensions: Integration Source
- Filters: Configuration Version Label: Production, Traffic Type: External
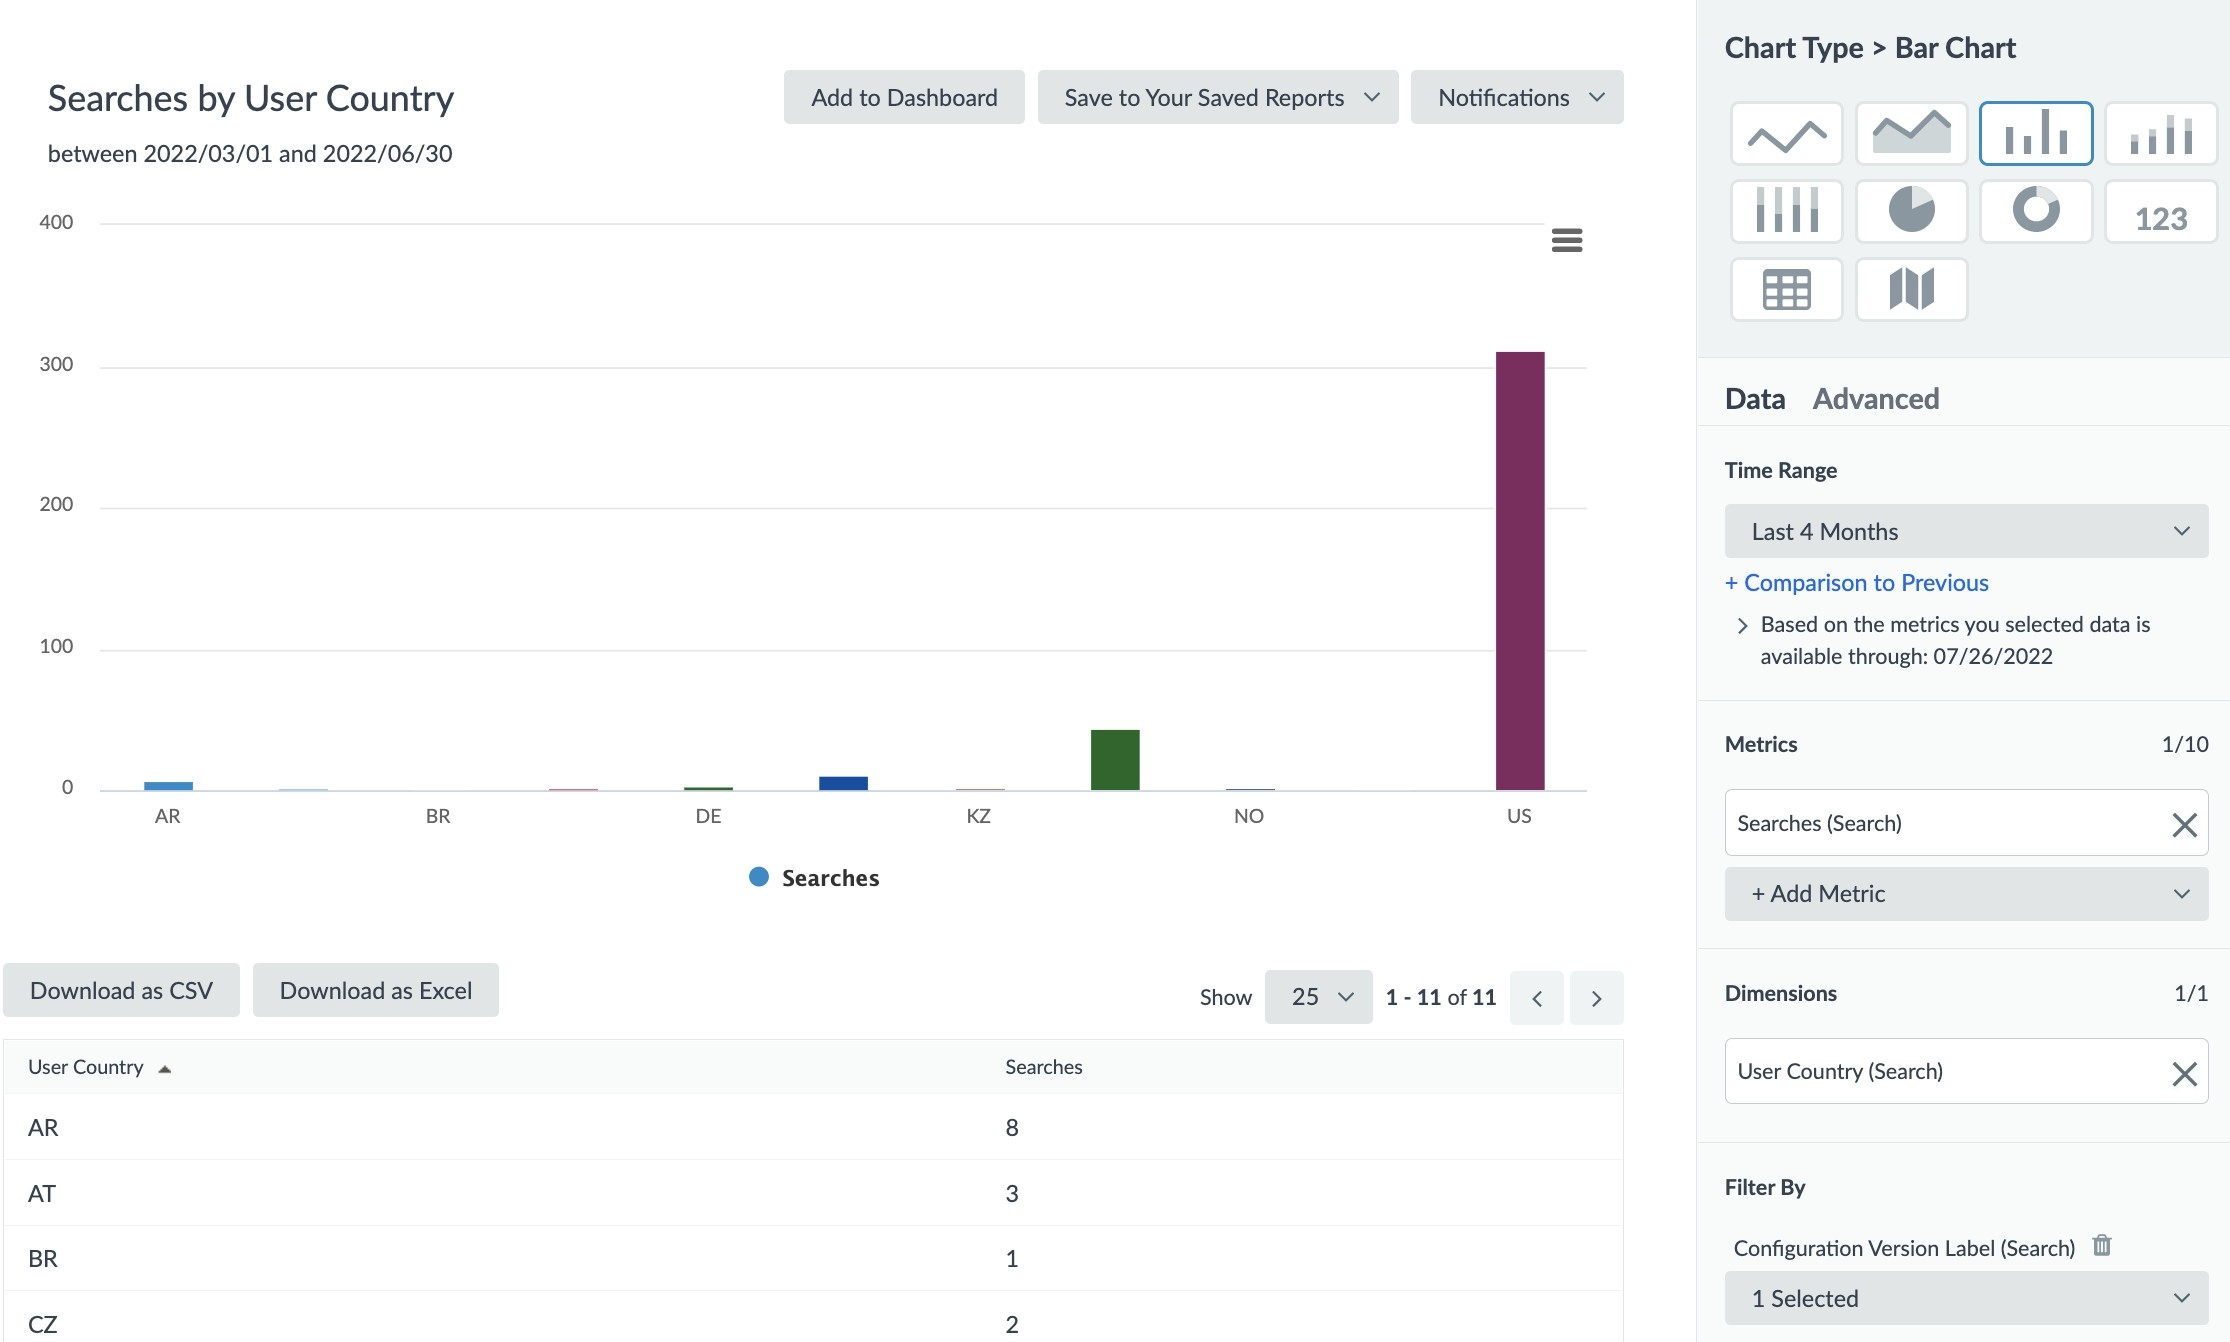
Trends Within and Across Geographies
Are users looking for and engaging with different content across different countries, regions, or cities? Perhaps you’d like to dig further into what users of a particular geography are searching for and clicking on, particularly if you have regional content or notice higher engagement in a particular area. The chart below dimensions by User Country. You can also filter any of the reports in the Common Examples section above for a geographical filter.
- Chart Type: Table Chart, Bar Chart, or Pie Chart, depending on your visual preference
- Metrics: Searches
- Dimensions: User City, User Country, User Locale, User Lat Long
- Filters: Configuration Version Label: Production, Traffic Type: External
Deflection Metrics for Support Search
We also have specific deflection metrics including Case Starts, Case Submits, Case Deflections, and Case Deflection Rate. These allow you to quantify the impact Support Search has on your business and customers. One key way to optimize your Search experience to ensure both your customers and agents get the answers they’re looking for (which will decrease the number of support tickets and increase support agent efficiency) is to look into which search terms led to a case submission or case deflection.
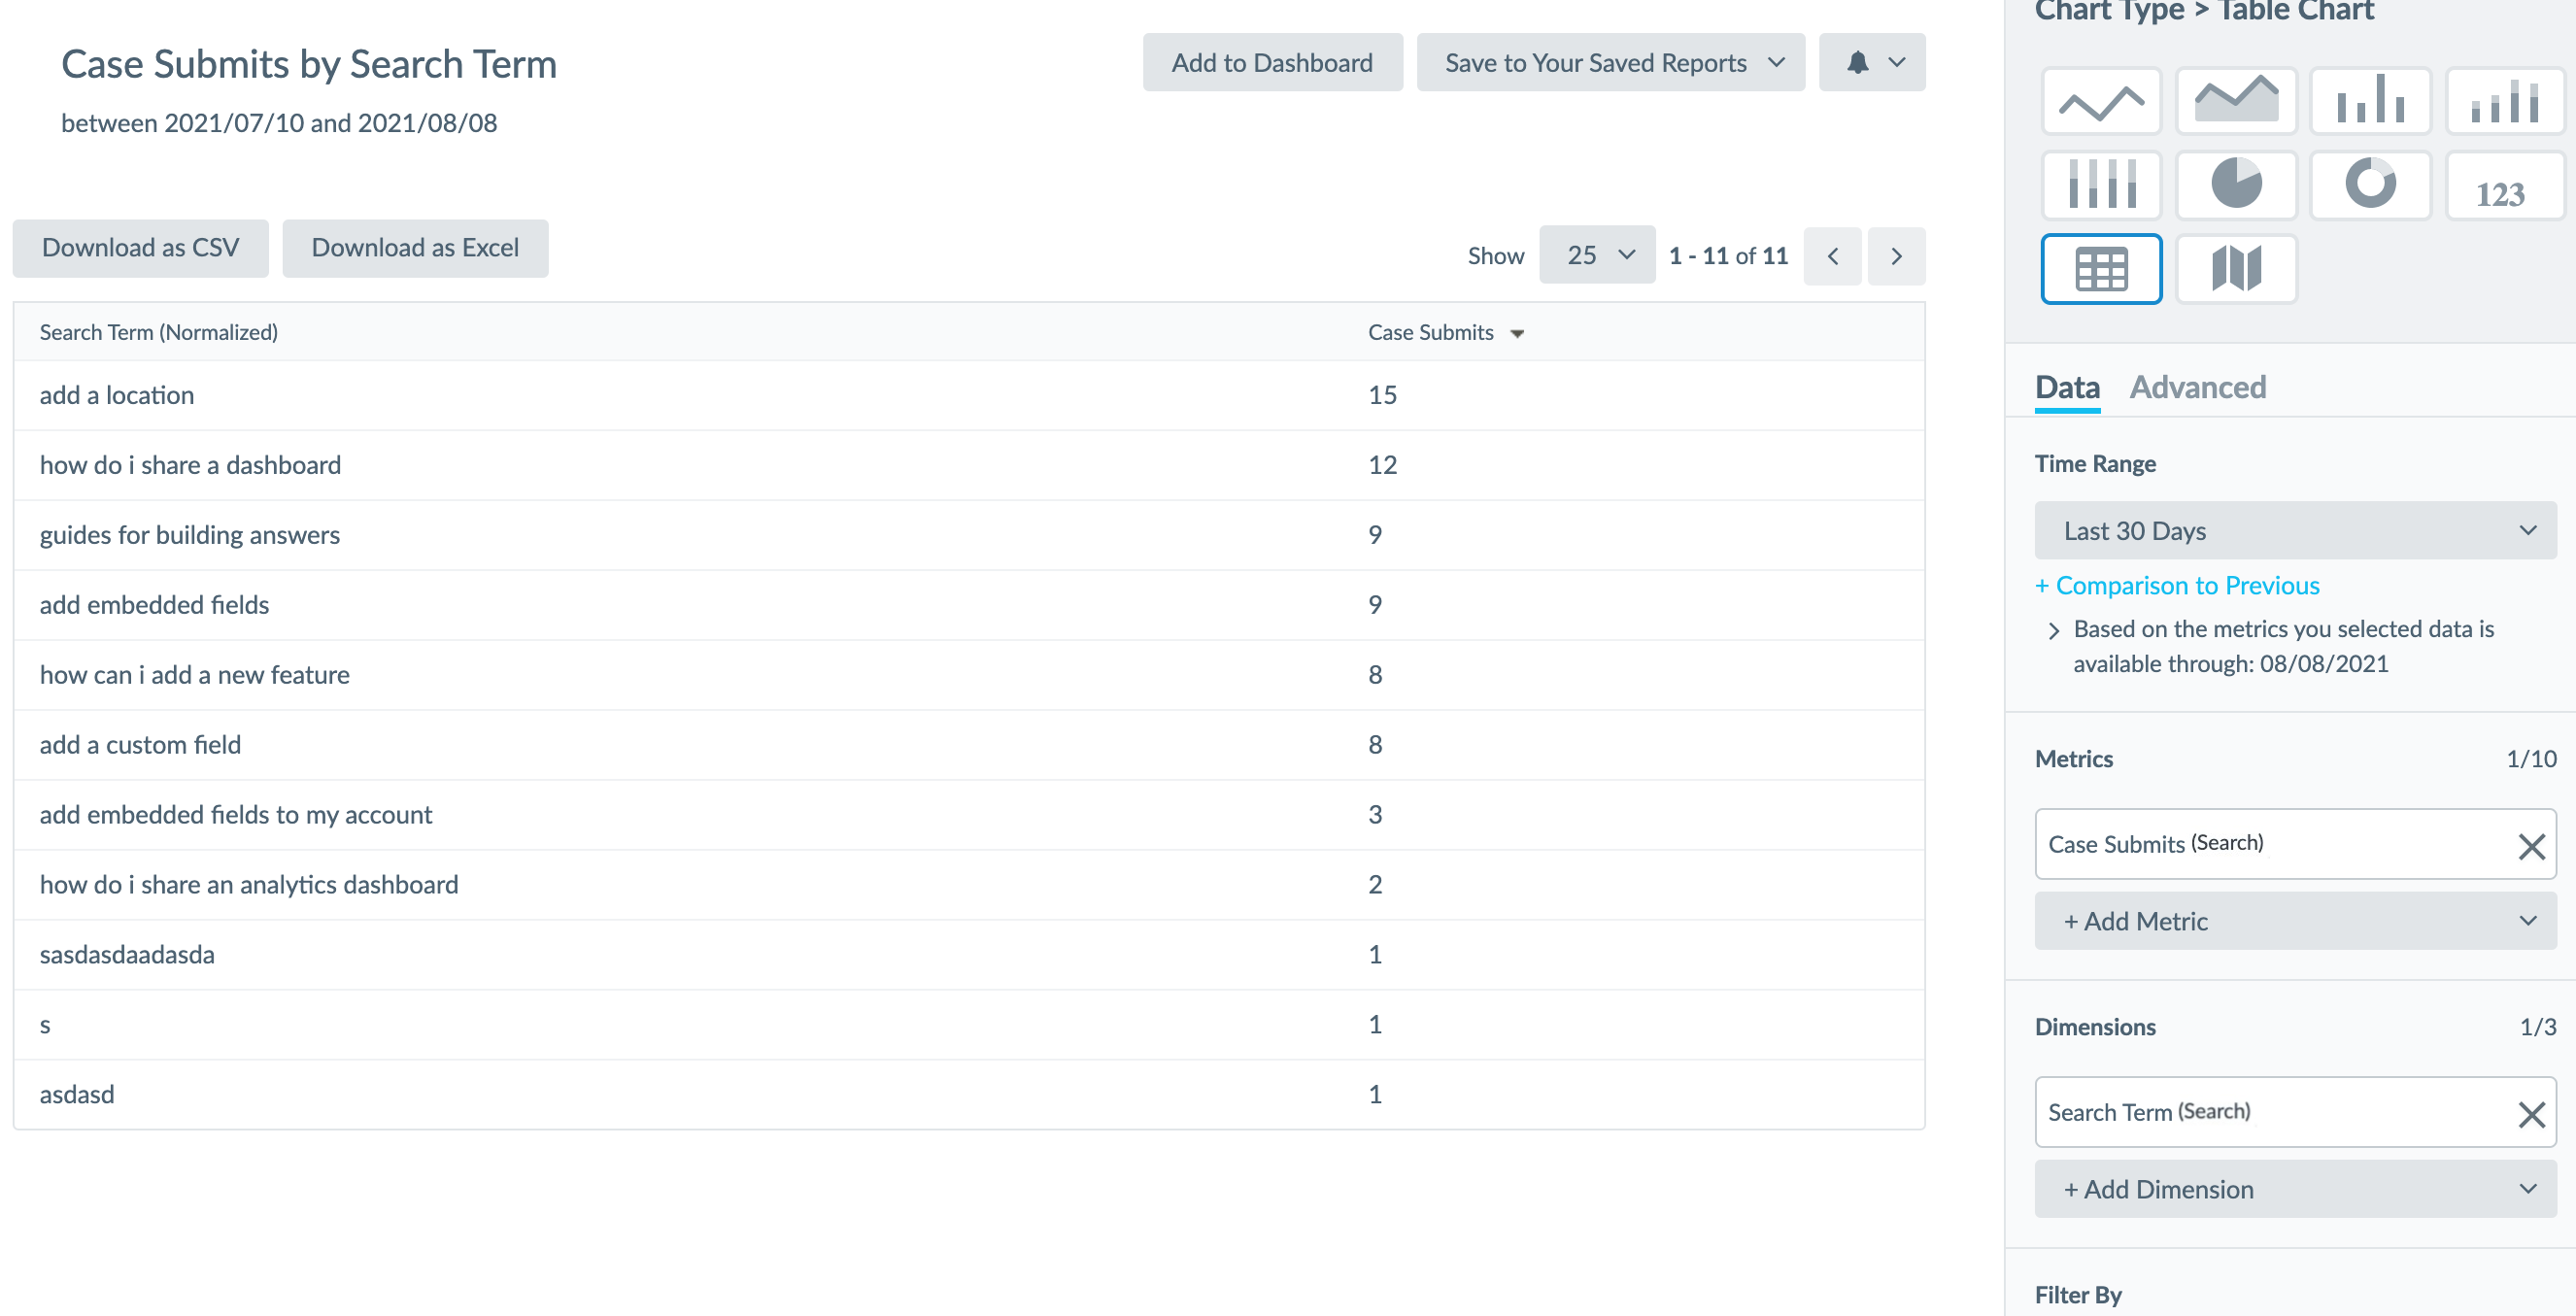
Search Terms That Led to Case Submission
If a user started their journey with search and ended up submitting a case, they weren’t able to find what they were looking for. This is a great opportunity to review these search terms for sufficient answers to decrease the number of cases you receive.
- Chart Type: Table Chart
- Metrics: Case Submits
- Dimensions: Search Term
- Filters: Configuration Version Label: Production, Traffic Type: External
- Sort: Case Submits: Descending
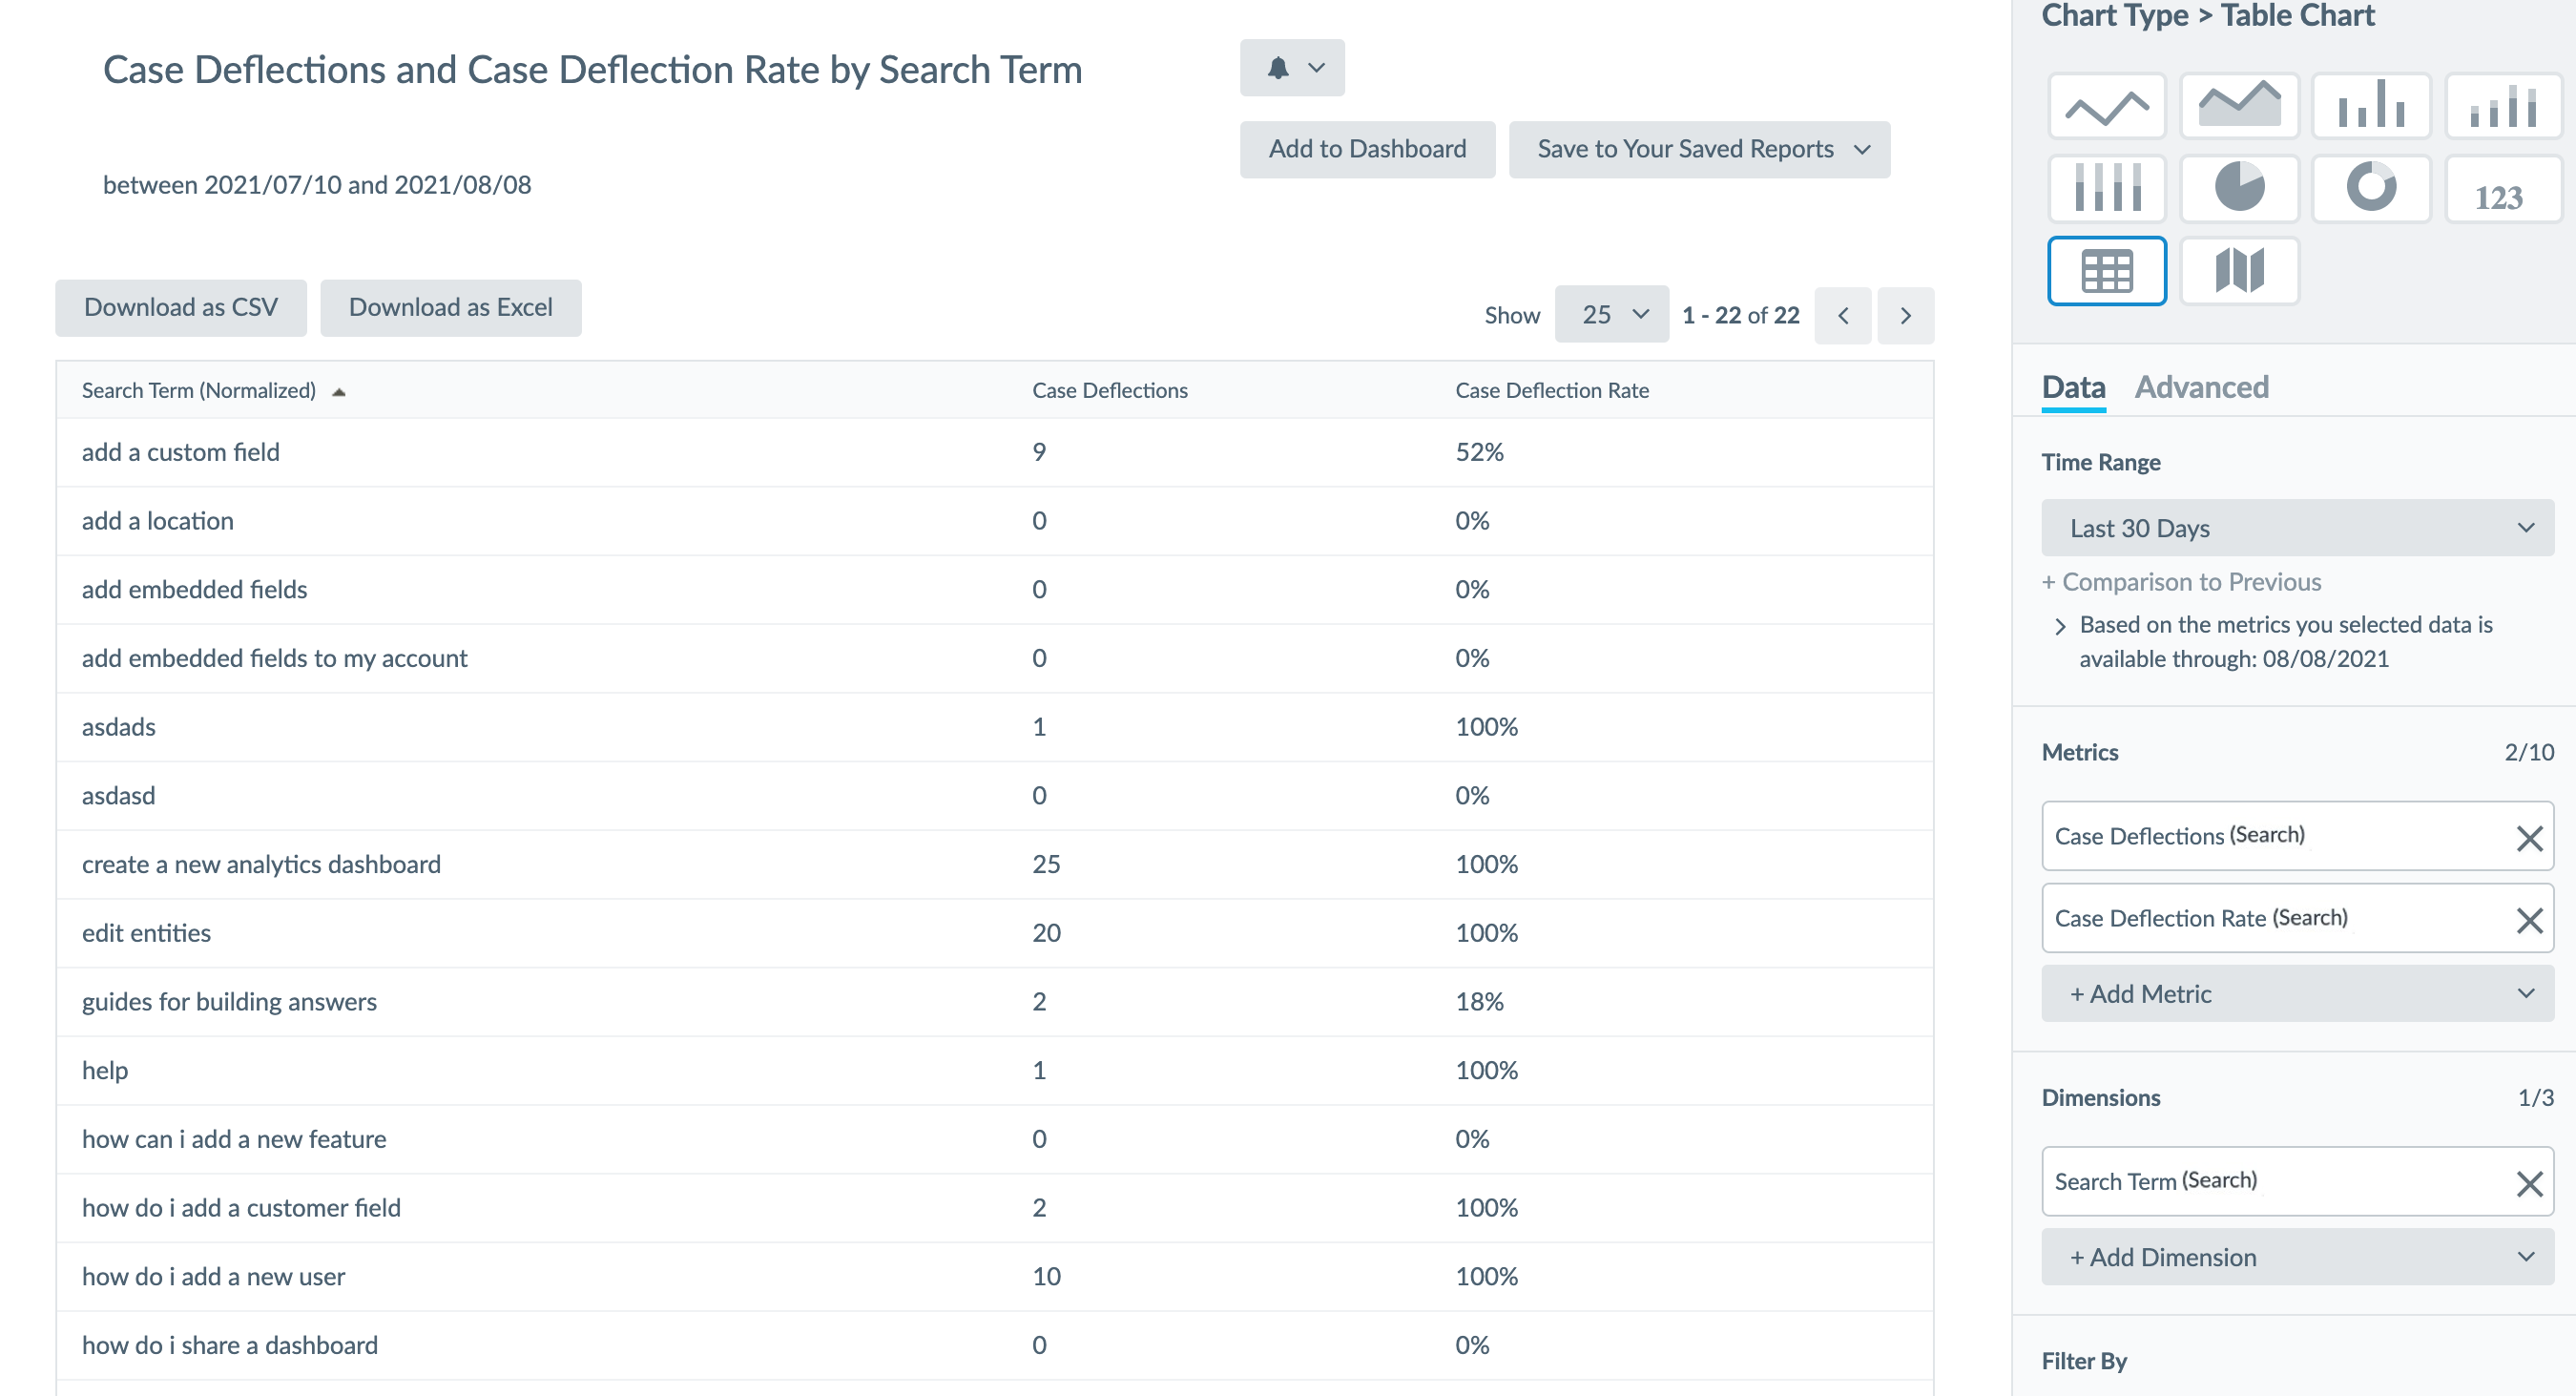
Deflected Search Terms
On the other hand, if a user started their journey and did not submit a case, they found what they were looking for and saved your support agents a case. This is a great way to show the value Search provides by decreasing the number of support tickets you receive! You can also analyze the Case Deflection Rate to determine how often a certain search term meets a user’s needs.
- Chart Type: Table Chart
- Metrics: Case Deflections, Case Deflection Rate
- Dimensions: Search Term
- Filters: Configuration Version Label: Production, Traffic Type: External
- Sort: Case Submits: Descending