

Social Summary Dashboard | Yext Hitchhikers Platform
When navigating to Analytics > Dashboards, there is an out-of-the-box dashboard set up to make Social reports simple to preview. On the left of the Dashboards screen under Account Dashboards, select Social Summary to open up the dashboard.
The dashboard is broken into six sections:
- Multi-publisher post activity
- Facebook Page Performance
- Facebook Post Performance
- Instagram Page Performance
- Instagram Post Performance
- Apple Post Performance
Within these dashboards, you can filter to see certain entities or date ranges if you want to understand social performance at a more granular level.
Each insight includes a caption in the form of a question that will help you understand the insight you are looking at and what question it answers.
Since this is a standard dashboard, you won’t be able to edit it directly. However, you can duplicate the dashboard if you want to make customizations that are relevant to your business, including changes to the captions.
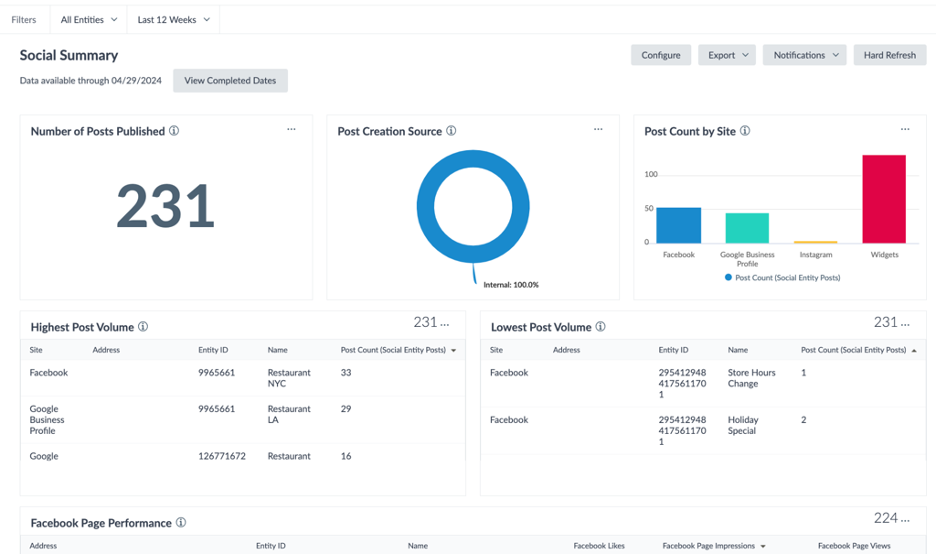
Multi-Publisher Post Activity
This first section allows you to see what your post activity is looking like at a high level. Some reports include information such as:
- The number of entity posts published (unique publisher / location post)
- Where the post is created (via Yext (internal) vs. directly on the publisher (external))
- Which publishers you are creating the most posts for
- Locations that are publishing the most vs. the least content. This could help identify gaps in social media strategy based on location.
Facebook Page Performance
Facebook has deprecated the following analytics:
Metrics:
- Facebook Check-Ins
- Facebook Page Unique Negative Actions
- Facebook Page Clicks
- Facebook Post Engaged Fans
- Facebook Post Unique Negative Actions
- Facebook Post Unique Clicks
Dimensions:
- Facebook Page Negative Action Type
Dimensions that can no longer be used with the Facebook Page Impressions metric:
- AGE
- GENDER
- COUNTRY
- CITY
- LOCALE
Option that can no longer be used with the Facebook Impression Type dimension:
- ORGANIC
This will impact Facebook reports on this dashboard. However, you can still view historical data (prior to September 16, 2024) in Yext until December 11, 2024.
This section of the dashboard highlights how well certain Facebook Pages are doing. You will be able to see which locations have the highest number of likes, impressions, page clicks, page reach, and page views, with several insights showing growth over time.You can also update the sorting to show the lowest-performing pages. This information could help you lean into strategies that are working well for certain locations or determine which Facebook pages need additional work.
You can see Facebook likes and impressions broken out by age and gender, and location. You can also see page likes that have been attributed to organic vs. paid content. These details help inform message tailoring or customer segmentation for overall social media strategy.
The Facebook page reach growth graph displays your page reach over time compared to the previous period. Similarly, the Facebook page click growths graph shows how page click volume changes over time. This shows the value of the posts being created.
The page new likes vs unlikes per week and page negative actions taken reports can help you determine how posts resonate with users and what type of posts can be improved.
Facebook Post Performance
This dashboard will be impacted by the Facebook metric deprecation. since post impressions and reach metrics will be deprecated.
Historical data will be available through November 5th.
This last section displays data about how individual Facebook posts are performing.
The first chart shows which post (by title and URL) has the highest impressions, reach, and clicks.
Then you will be able to see a graph of post reach by day as well as which of those post views were attributed to paid versus organic content. The next bar graphs break out engagement by day. This can allow you to optimize your post schedule since it can keep you informed on what times your posts perform best.
Next, you will be able to see posts that have the highest number of reactions followed by data about posts with negative reactions and actions taken. This can help you take steps to mitigate negative reactions by users if you know what kind of content isn’t resonating with them.
The last report shows the breakdown of paid versus organic reach. This is helpful if you boost posts on Facebook via paid channels as it can help you determine if your marketing dollars are going to good use.
Instagram Page Performance
Note: Instagram posting is only available for resellers currently. Therefore, for non-resellers, these reports will show up as not having enough data or no access.
The first table shows your overall Instagram page performance, including which pages have the highest impressions, reach, and views.
Then you will be able to see new followers per day and reach per day. There are also reports for engagement which break down unique accounts that are interacting with your content and the engagement rate on the page. These metrics can help give a sense of the overall opportunity for audience engagement.
Next, there are graphs for Instagram page actions by type and page saves and shares. Below that, there are growth charts broken down by engagement, likes, and comments. This can inform how users are interacting with your page and if they are resonating with your page content.
Instagram Post Performance
At the top of this section, you can see overall post performance in terms of impressions and reach.
Next, you can see reports that show the engagement rate by post, the number of interactions, and the number of saves by post. These details show how posts are resonating with users. If there is little interaction with your Instagram posts, it could signal that the type of content your posting may need to be updated.
Apple Post Performance
Apple only supports one metric for Apple Showcase posts - “Apple Showcase Taps.” This report will show the number of taps on your showcase posts per location. Note: If you receive less than a few Showcase taps on a given post, Apple will not return any data for privacy reasons.