Create Analytics Dashboards | Yext Hitchhikers Platform
What You’ll Learn
In this section, you will learn:
- How to leverage Analytics dashboards
- An overview of Analytics dashboards
- How to create and customize dashboards
- How to check the latest date data is available
Overview
Yext’s Analytics Dashboards allow you to pull all the insights from Pages, Listings, and Reviews into a convenient, customizable, centralized view.
Dashboards can be customized and purpose-built to appeal to any audience. You can create the same dashboards for everyone in your organization, or customize them based on who’s logging in, how much time they have, and how much access you want to grant them.
There is no limit to the number of dashboards you can create in your account and no limit to the number of insights you can add to each dashboard.
Build Dashboards for Any Stakeholders
Below are some examples of the type of dashboards you can create:
- Individual Location: Filter the data to the location level to help Location Managers or Franchisees understand their location.
- Regional Managers: Drill down to the Regional or District level to identify key takeaways for specific geographical groups of locations.
- Executive Teams: Share high-level metrics with your executive team in a single, comprehensive report to highlight how the brand is performing overall.
- Marketing Teams: Build a unique dashboard for your Social, Paid, Ecommerce, and SEO teams to surface metrics that matter for their roles.
Create Analytics Dashboards
- Click Analytics in the navigation bar.
- Click Dashboards.
- Click on the +Add Custom Dashboard button on the right side of the page.
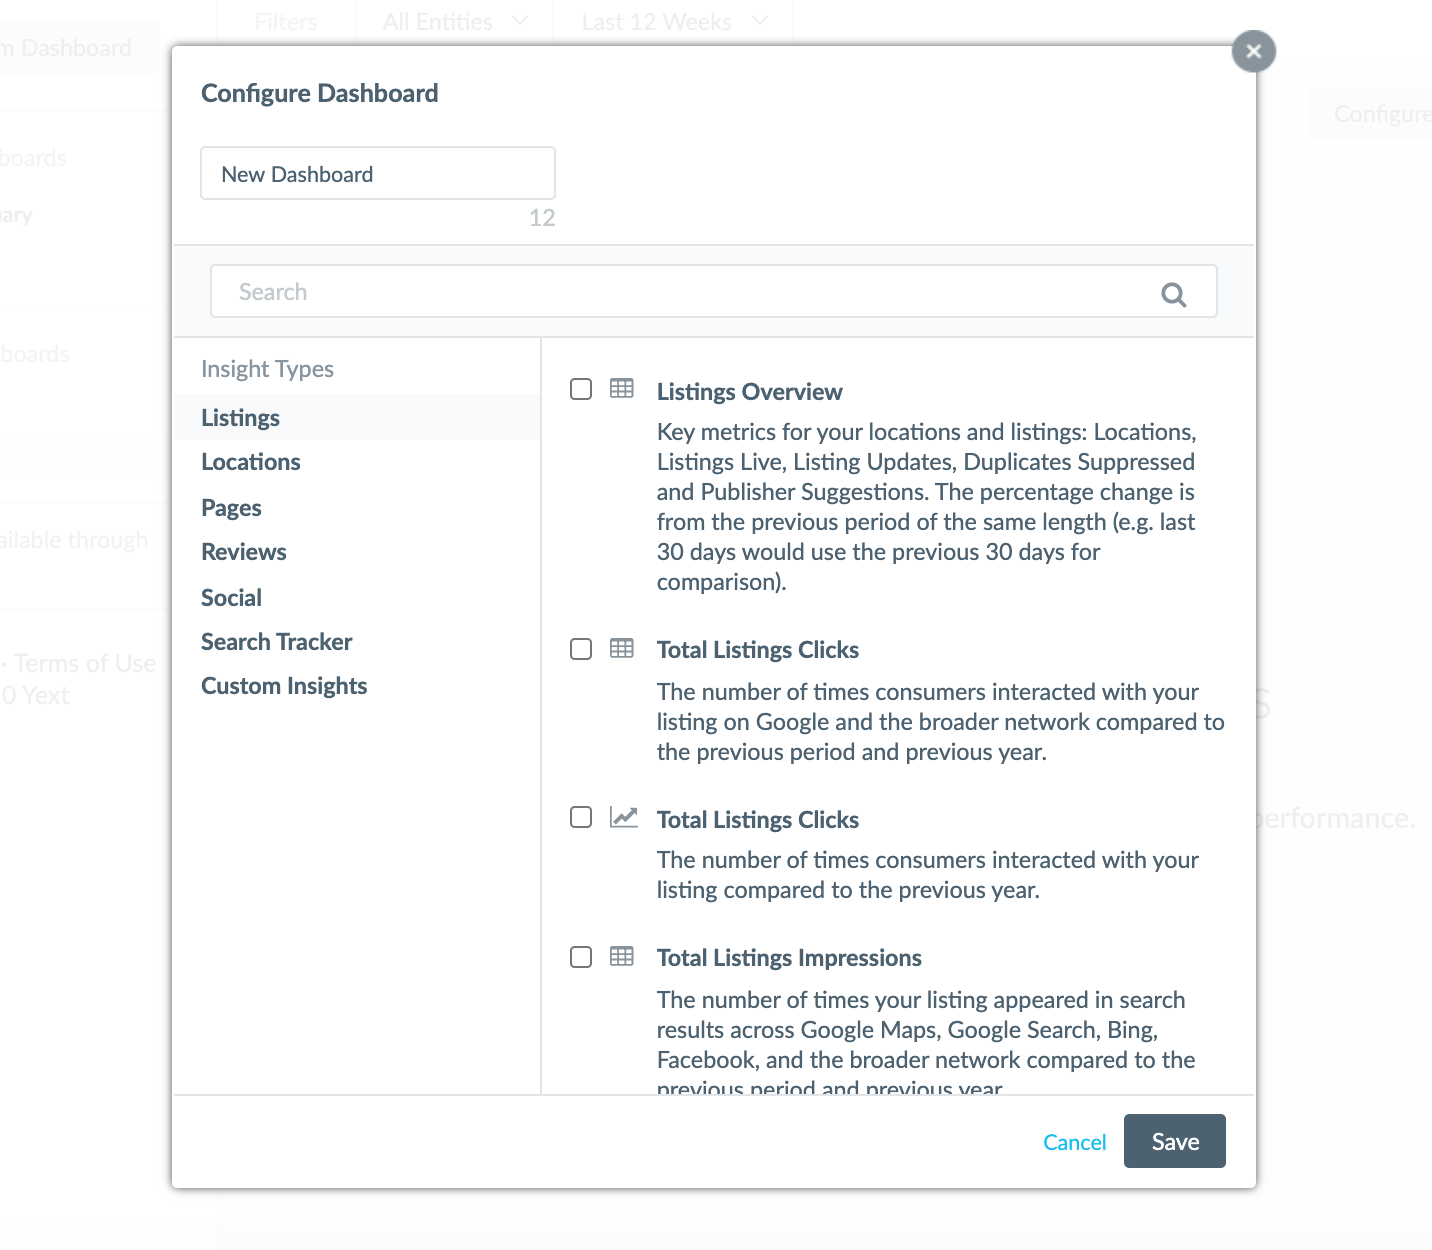
- Enter a Dashboard Name.
- Select the insights you would like to include in your dashboard.
When selecting your insights, you can select from the pre-built insights library, or you can select a custom insight that you create.

If the insight you would like to add is not yet created (either pre-built or a custom insight that you created), you can create it in Report Builder and save the report to your dashboard. Check out the Report Builder Custom Insights unit to learn how.
Duplicate an Existing Dashboard
To create a new dashboard by duplicating an existing one:
- Hover over the dashboard name in the sidebar, then click on the drop-down button and select Duplicate.
- Change the dashboard name, make your desired changes, and click Save.
Adjust your Dashboards
You can also always adjust a dashboard by clicking on the Configure button on the right side of the page.

This allows you to add additional insights, remove insights, or adjust the size of insights on the dashboard.
Add Captions
Depending on who is viewing your dashboards, you may want to add additional information to help users understand the data they’re looking at. You can easily add captions to each of the metrics on your dashboard. To do this:
- Click on the three dots in the top right corner on an insight and click Add Caption.
- Enter your caption into the textbox and click Save.

Add Hero Numbers to your Dashboards
Hero numbers are the large numbers at the top of the dashboard that highlight your account’s most important metrics. They display the total values as well as the period over period percentage change (if enough data is available). Each hero number corresponds to a metric (of the same color) within the chart. Toggle lines on or off by clicking the hero number. This makes it easy for you to view trends for one or all of your metrics at once.

To add hero numbers to your dashboards, first create a line chart insight in the platform, then go to CaC and update the display section of the insight from
"display": {
  "line": {
  }
}
to
"display": {
  "line": {
    "heroNumbers": {
      "show": true
    }
  }
}
Find Date Data is Available Through
When selecting the desired time range, keep in mind different data sources will have data available through different dates. Listings data is typically delayed for quality assurance checks to ensure the data we share is of the highest quality. Delayed data is marked with the Watermark Date to show the latest date data is available through. Learn more about the Analytics Watermark Date for Listings in the Listings Metrics unit .
Analytics dashboards (and reports) automatically handle data lag between different Yext products. They are responsive to the products you selected - dynamic filters (such as Last 30 Days, Last 90 Days, etc.) will automatically adjust their time windows based on the product(s) that are being displayed - making it easy to always see the most complete picture of data possible:
- Dashboards with single products show the most up-to-date data for that product. For Search-only reporting, this is typically through yesterday.
- Dashboards with multiple products shows data through the latest date data is available for all products to ensure reporting on the same time period.
Dashboards will also display dates data is available through for each data source and for the dashboard as a whole. Click on the View Completed Dates button to see more.

What type of insights can you add to an analytics dashboard? (Select all that apply)
How can you create new analytics dashboards? (Select all that apply)
True or False: Dashboards with multiple products will include all data available for each product
Soon you'll be your brand's hero! 🎓

