Reviews Summary Dashboard | Yext Hitchhikers Platform
What You’ll Learn
In this section, you will learn:
- Introduction to the Reviews Summary dashboard
- Insights available and how to use them
Reviews Summary Dashboard
The Reviews Summary dashboard is found under Analytics > Dashboards in the navigation bar, and then under Reviews Summary on the left of the screen.
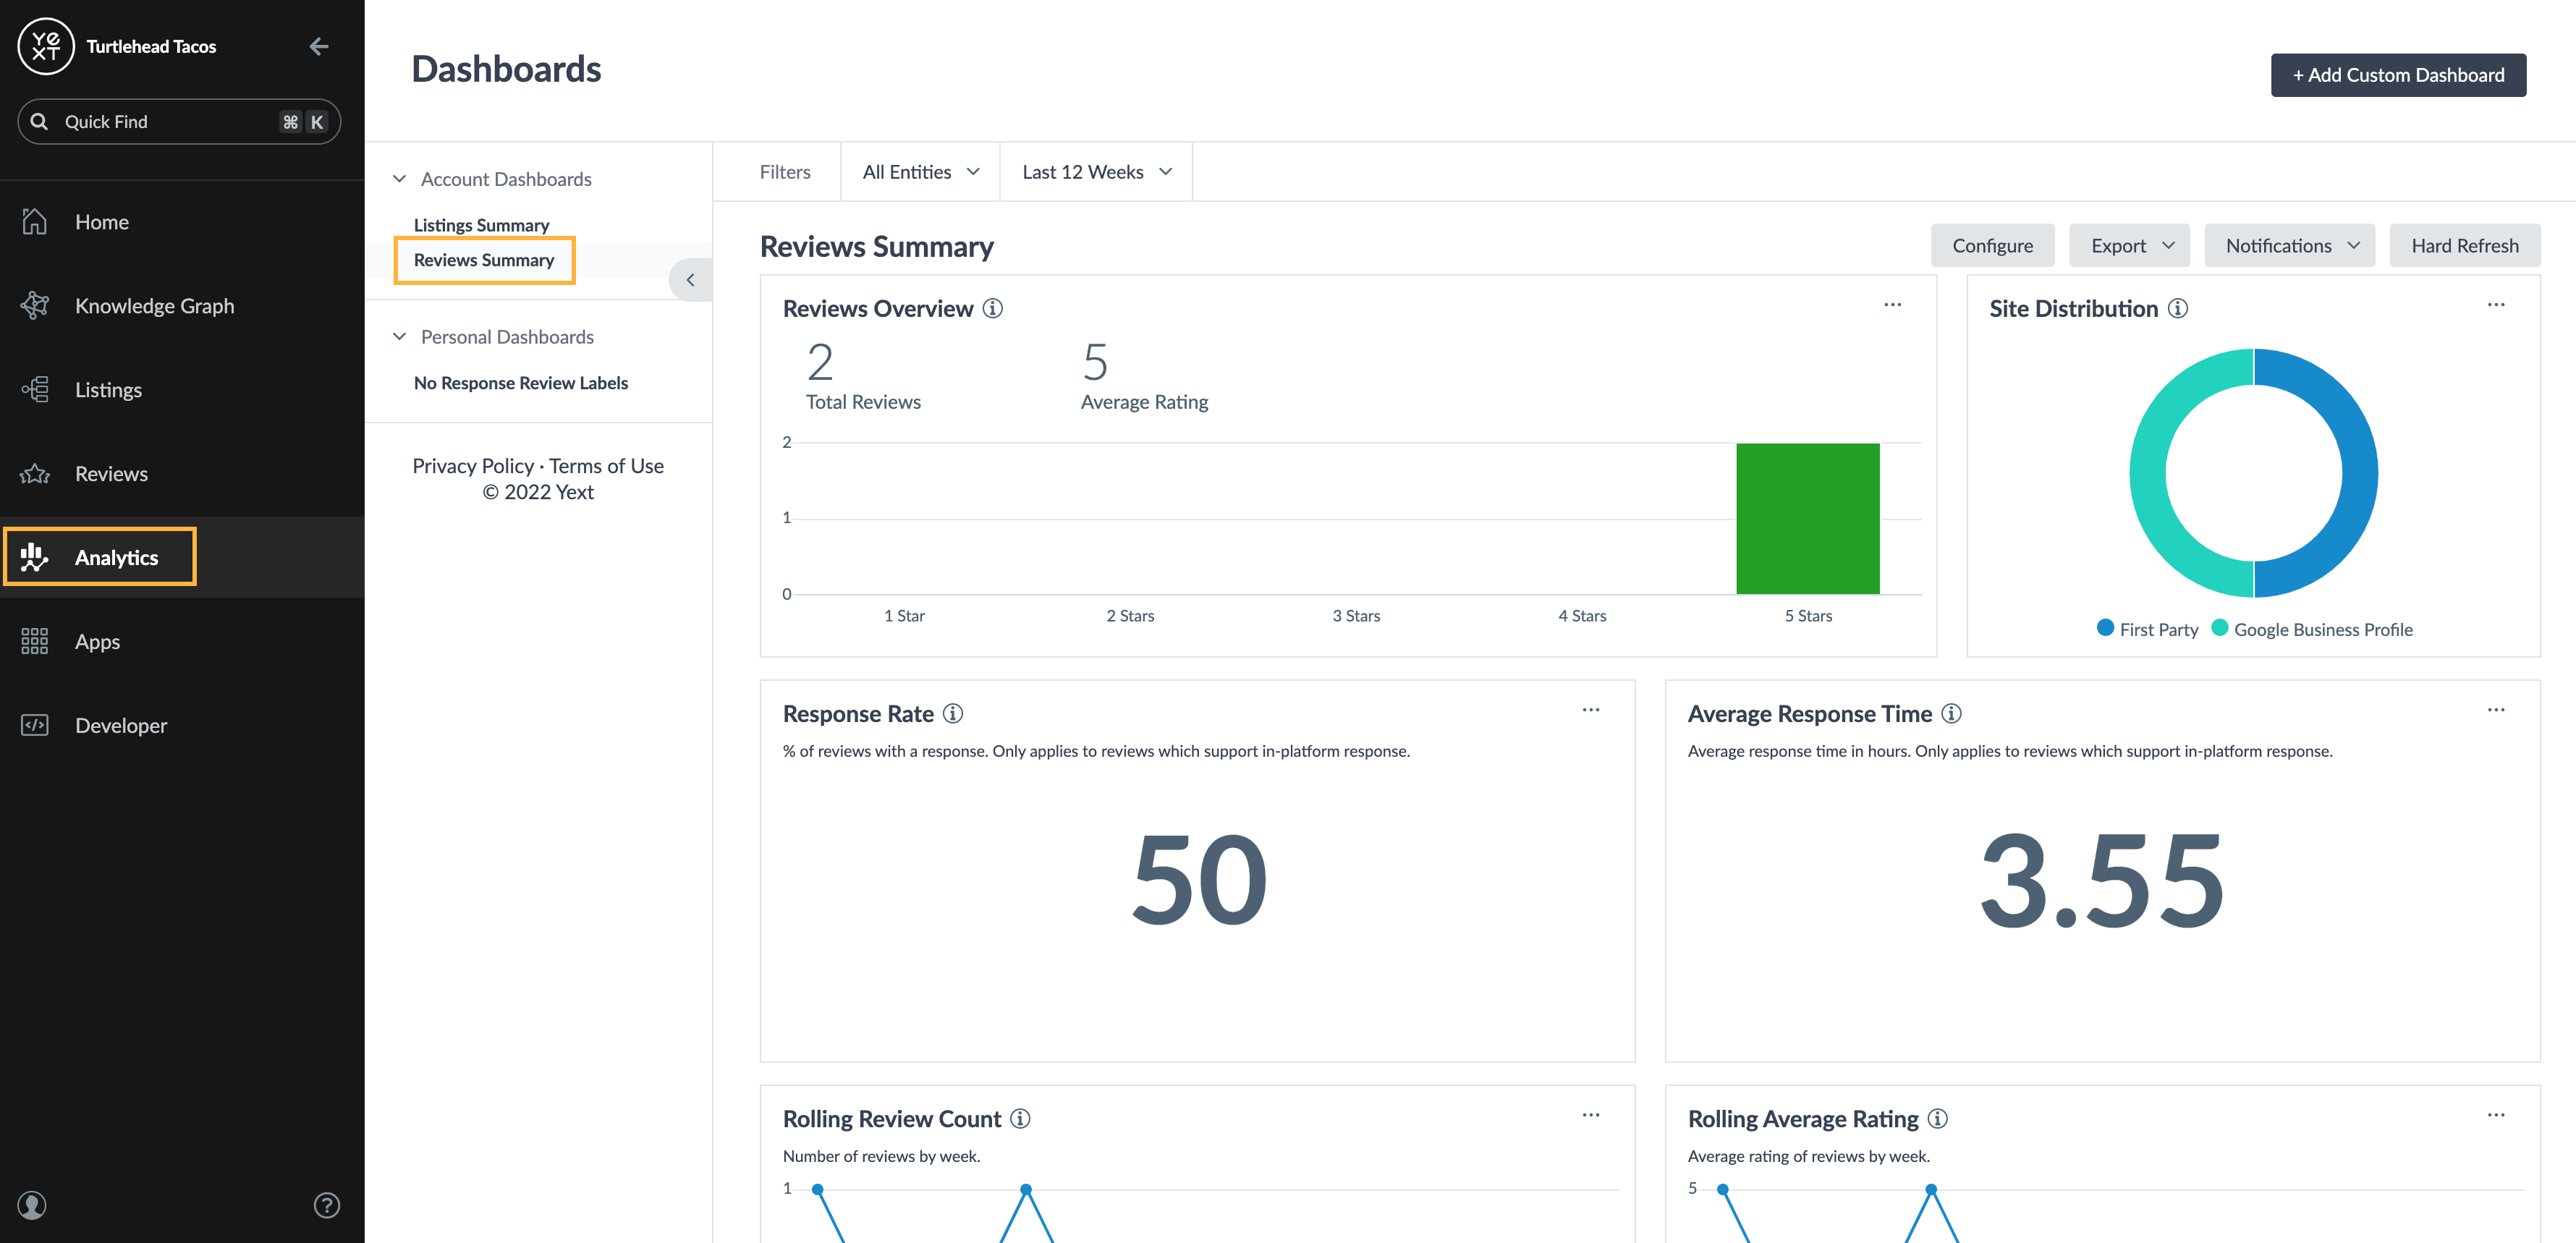
The Reviews Summary has a number of out-of-the-box metrics to provide a high-level comparison of your entities and overall review performance. Like many dashboards in the Yext platform, you are able to use the filters at the top to filter by location, date, site, and more.
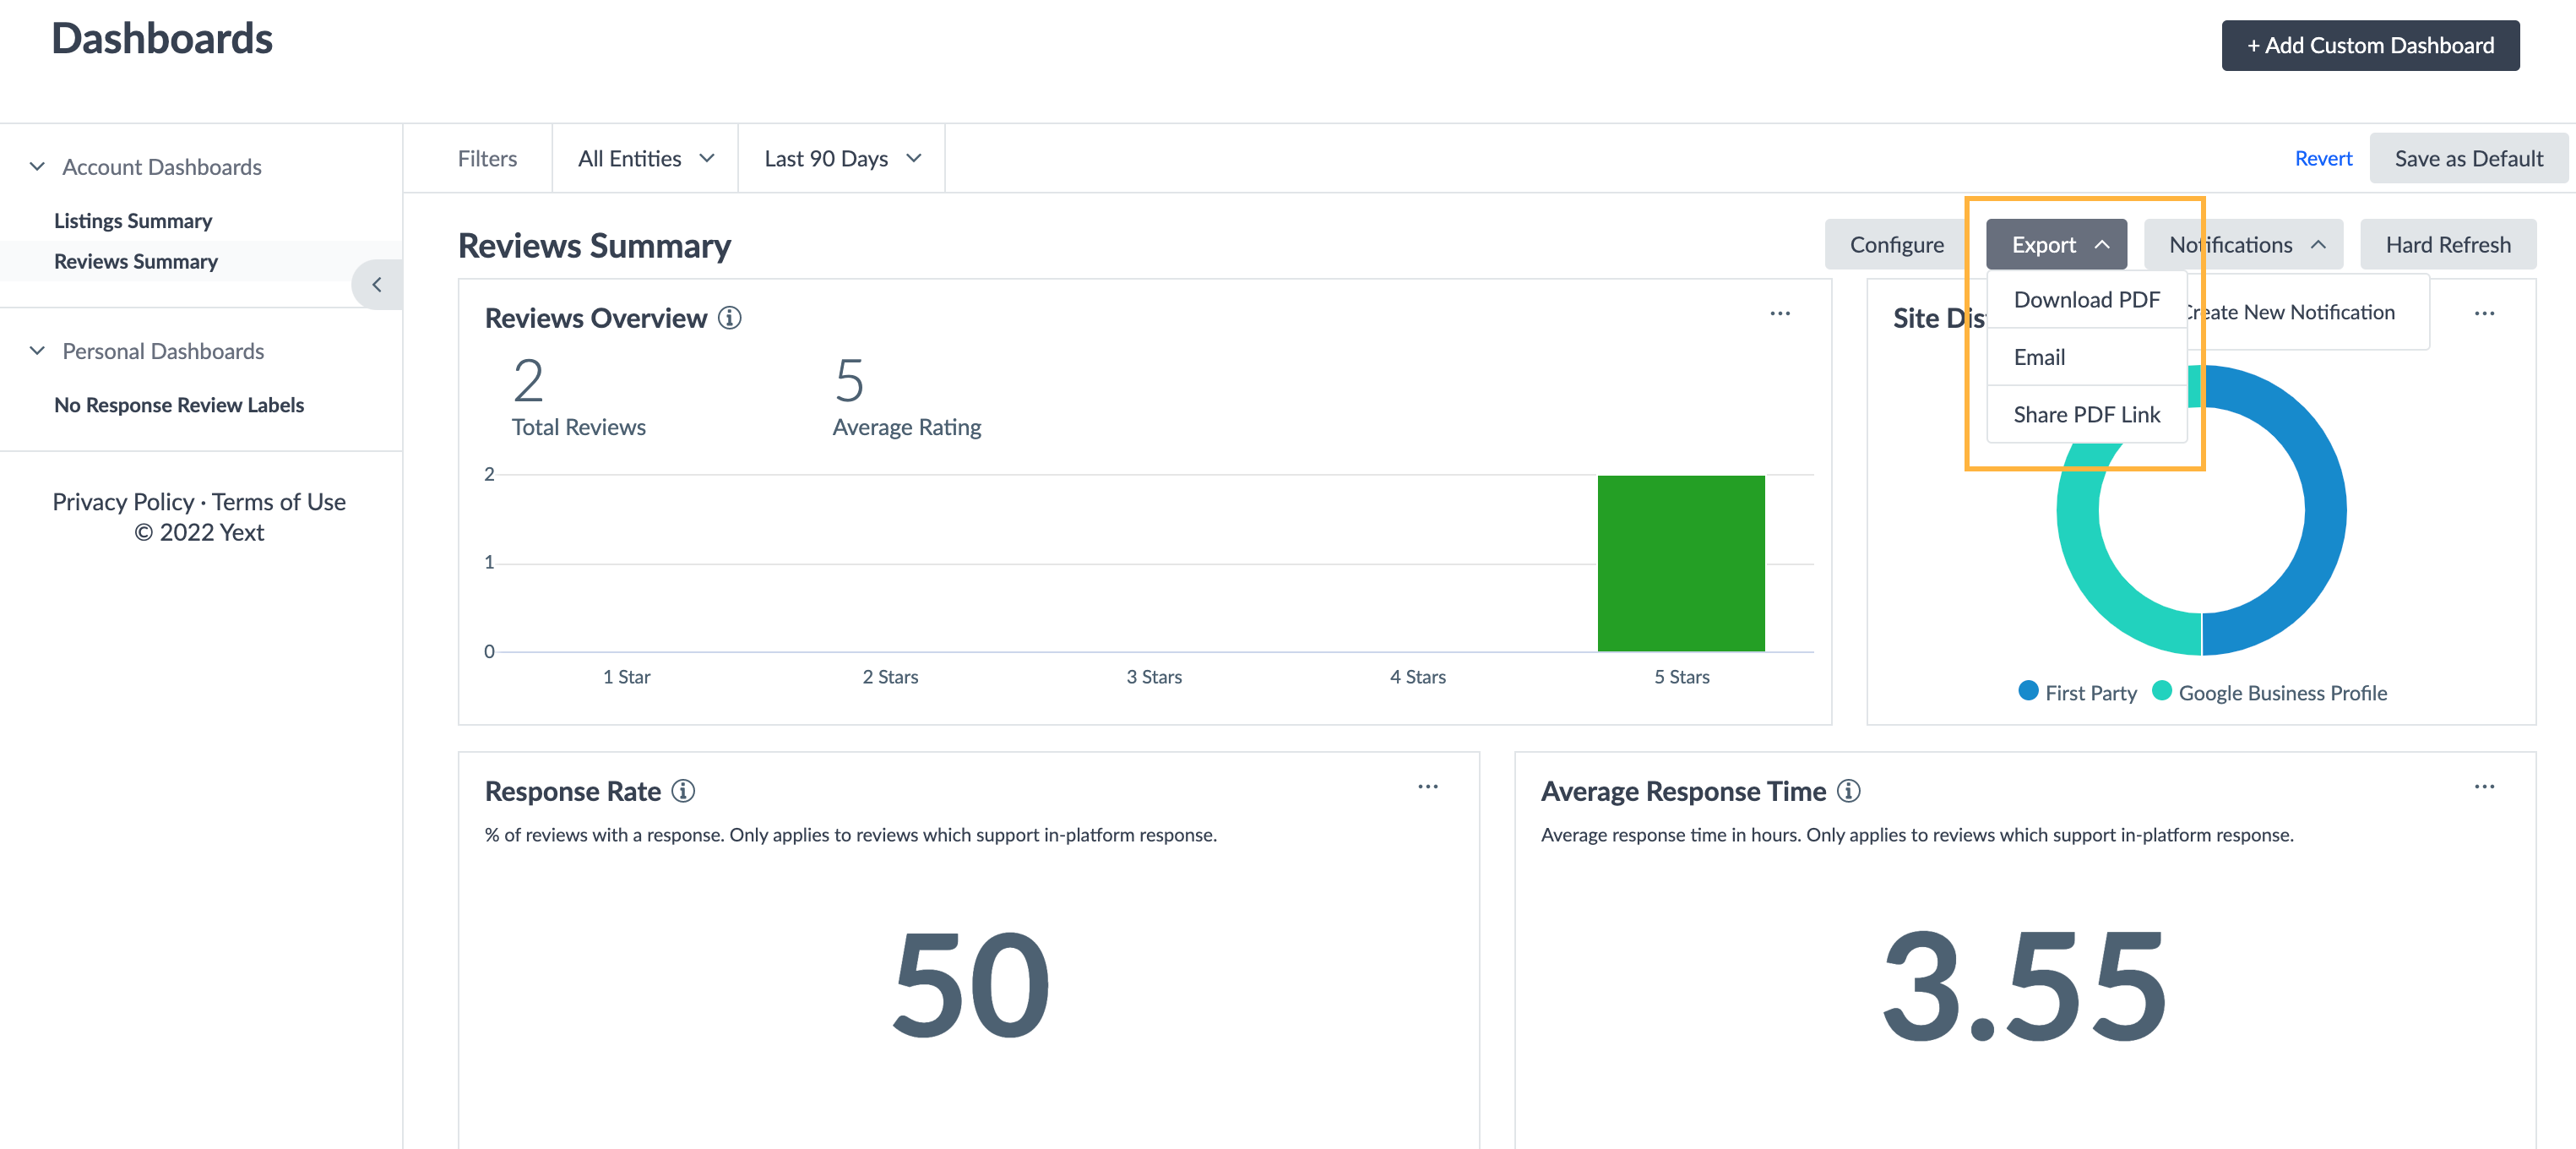
Reviews Summary insights can be downloaded as a PDF by clicking the Export dropdown in the upper right > Download PDF. You can also choose Email to send it to users or email addresses of your choice, or Download PDF Link to send a link to a PDF version. Alternatively, you can have it delivered as a notification at any frequency of your choice (create a notification by selecting the Create Notification dropdown).
Available Insights
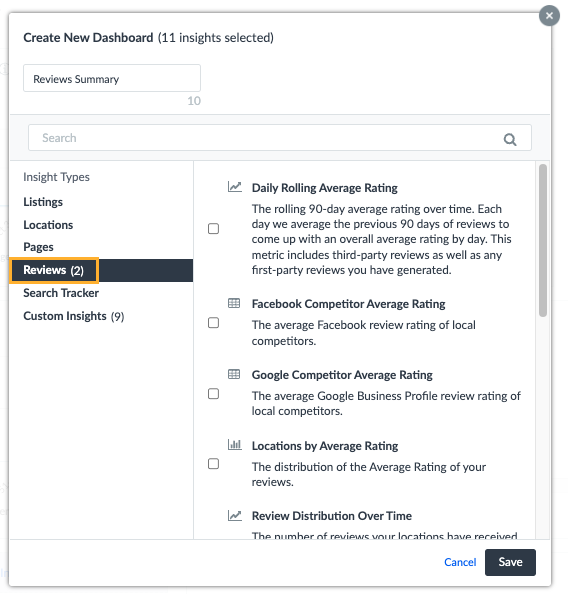
These insights, or metrics, are pre-configured on the Reviews Summary dashboard. You can change what insights are displayed on the Reviews Summary by clicking the Configure dropdown in the upper right. In the modal that appears, select Reviews on the left, select which metrics you’d like to display, and click Save.
Reviews Overview
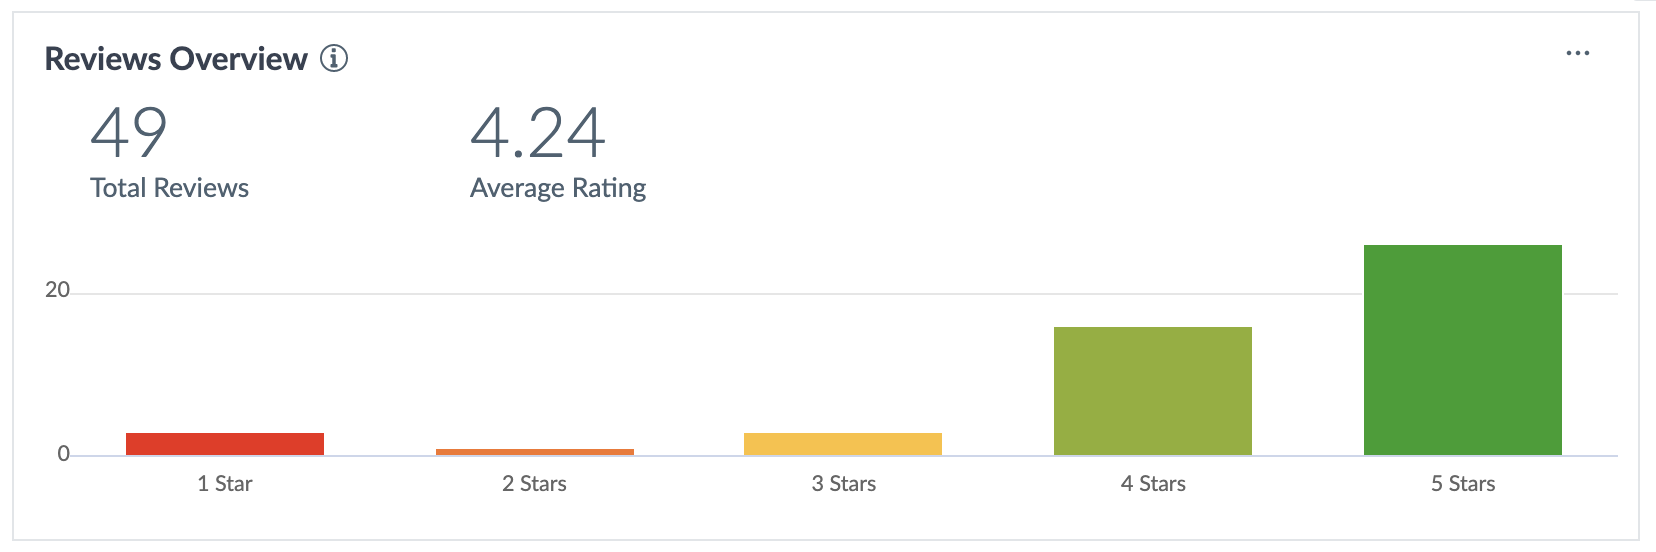
This graph contains three insights:
- Rating Distribution: The reviews received during the selected timeframe on the dashboard, broken out by star rating (1 through 5)
- Review Count: The cumulative number of reviews received during the selected timeframe on the dashboard
- Average Rating: The average star rating received for the selected timeframe
Response Rate
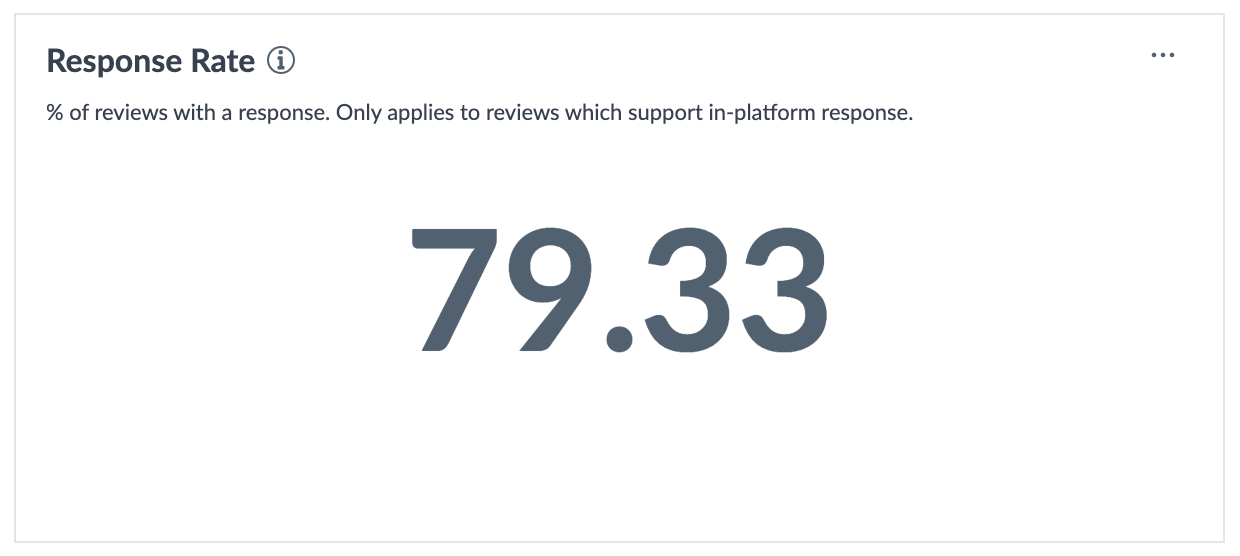
Response Rate is the percentage of reviews that have a response from your team. This insight only applies to reviews that support in-platform response (meaning they can be responded to directly from Yext — we covered this in the Review Response module ).
Average Response Time
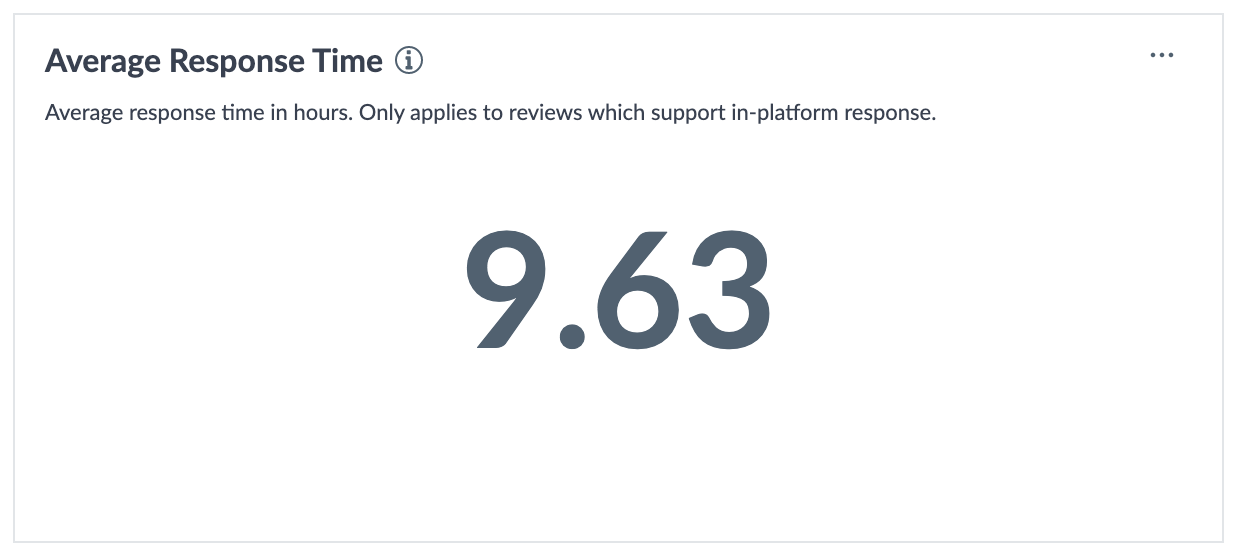
Average Response Time is the average number of hours before a review receives a response. Like the Response Rate insight, this only applies to reviews that support in-platform response.
Reviews Map
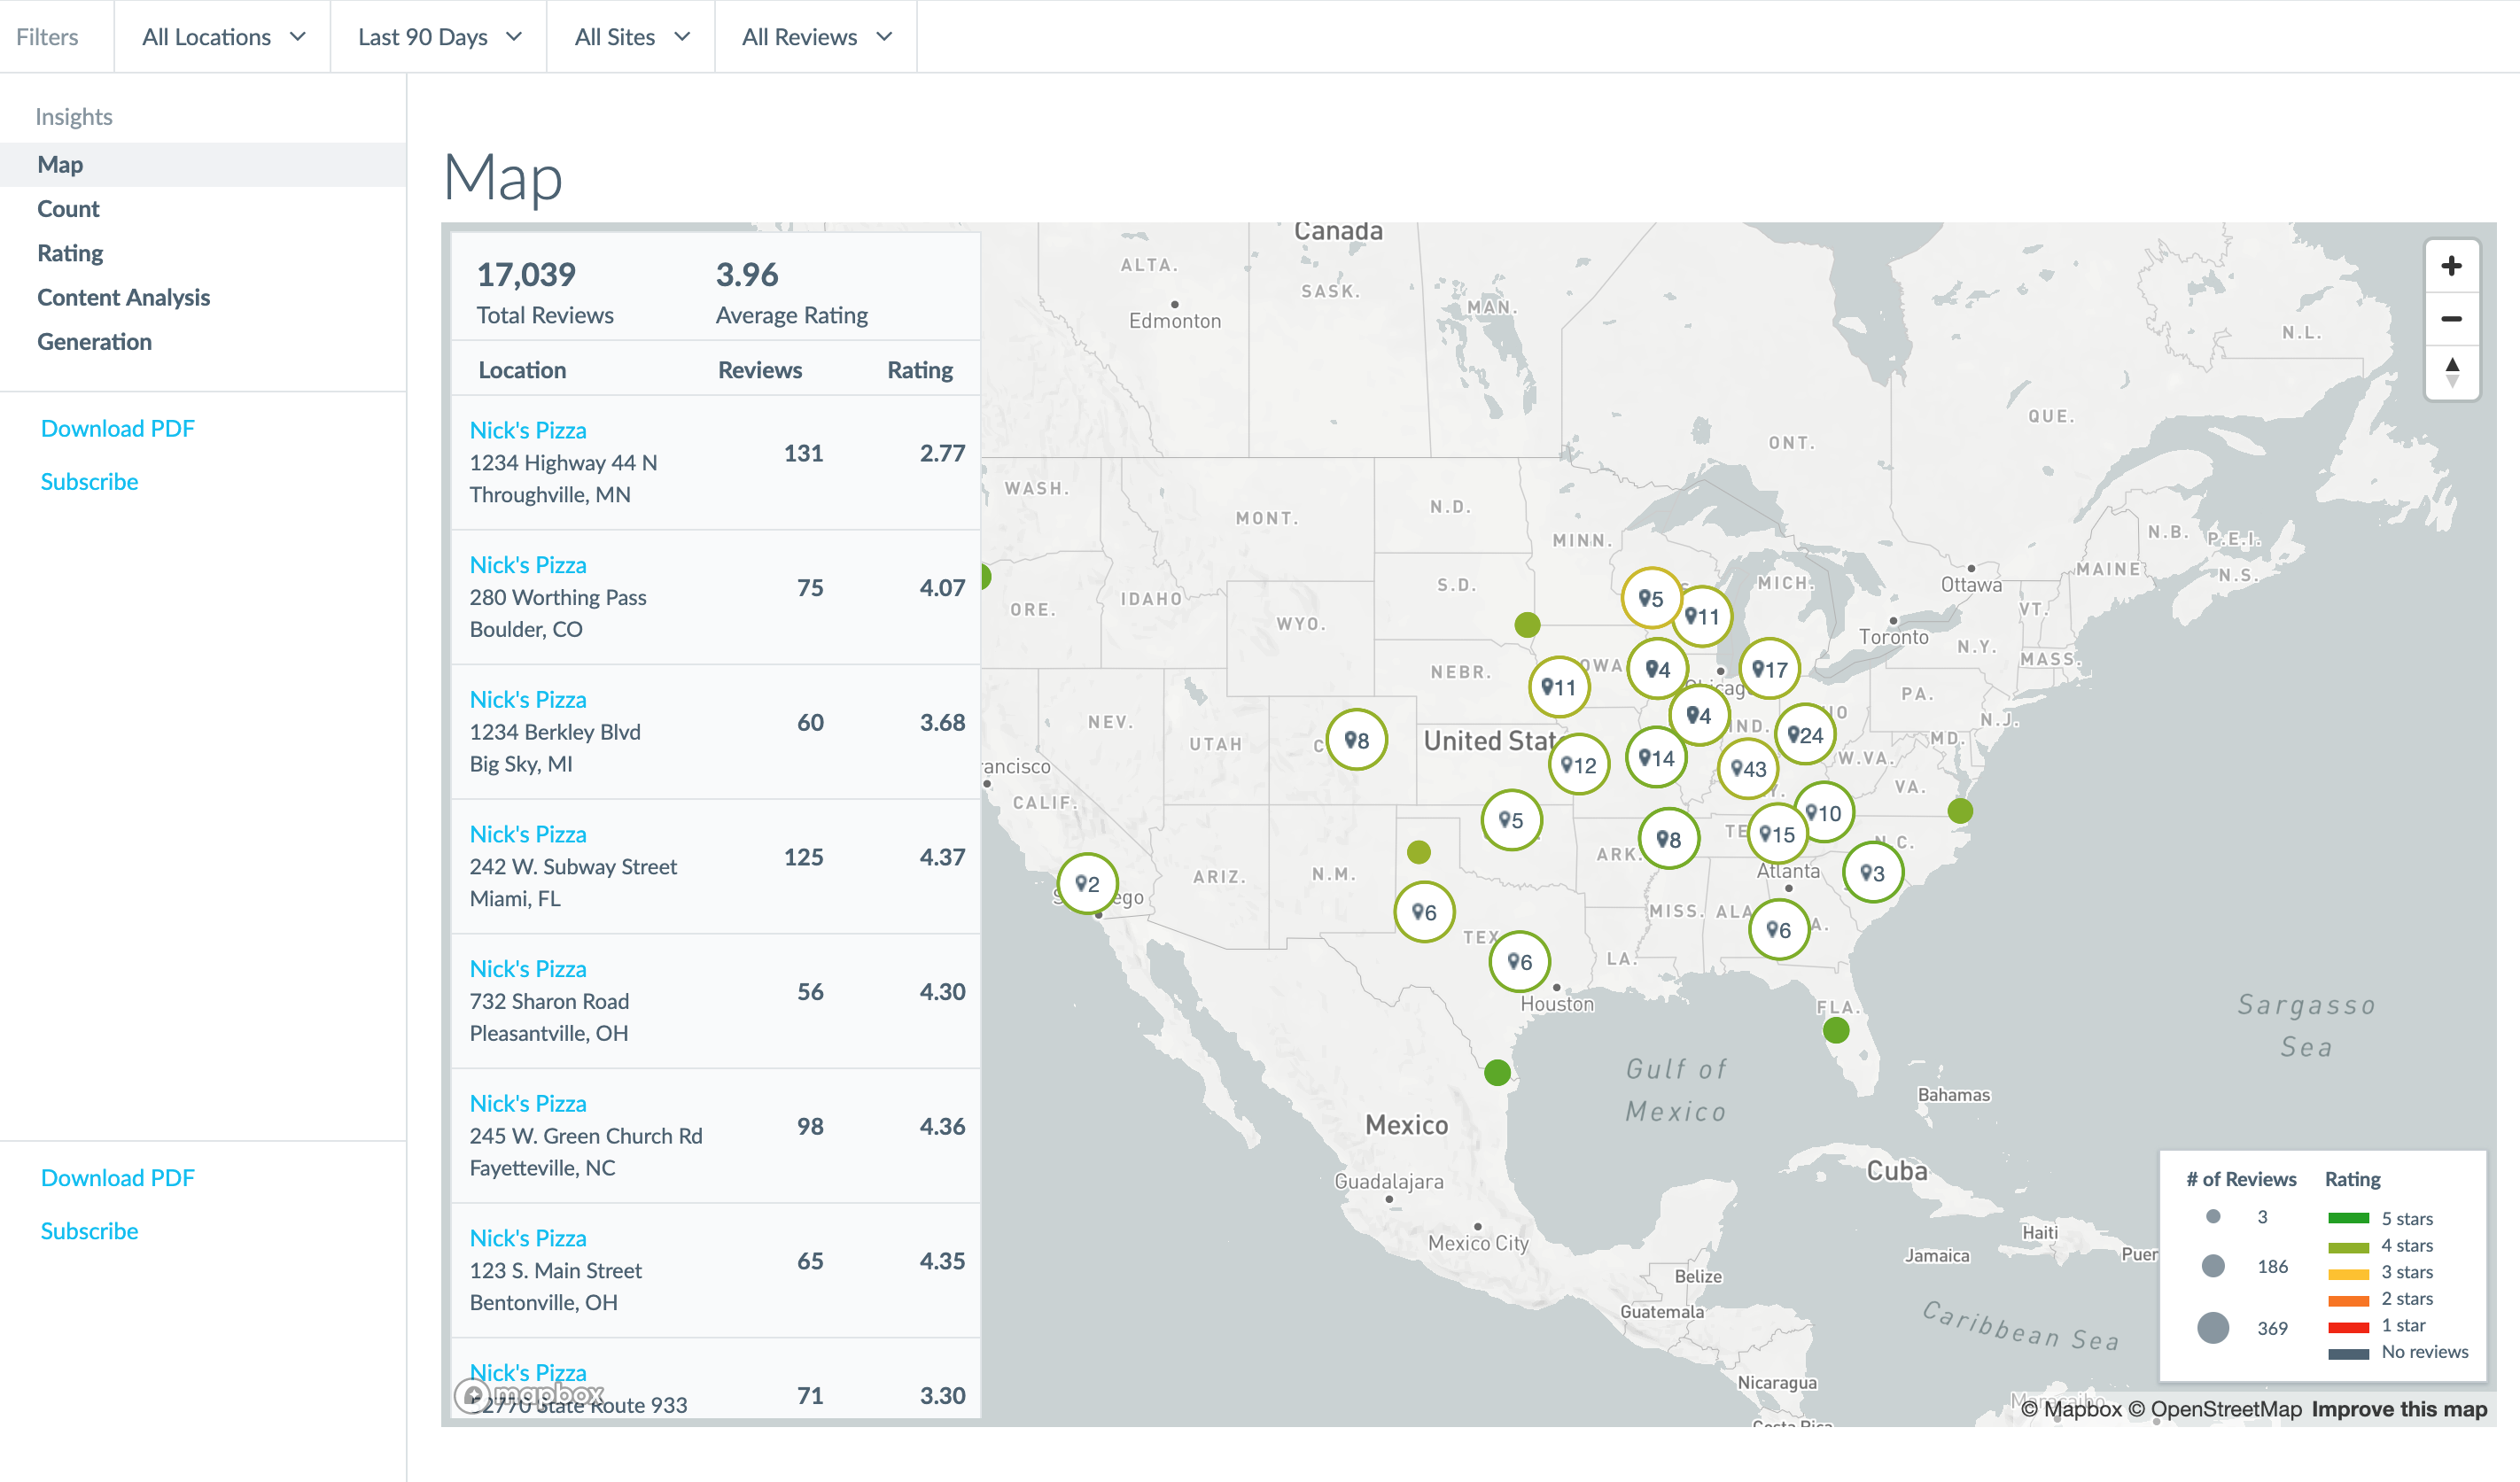
The Reviews Map displays a visual of where your reviewers are located, and is a great place to look to find geographical trends. The size and color of dots will compare the number of reviews and star rating, respectively. Interacting with the map and zooming in can provide more detail on areas with multiple locations.
Site Distribution
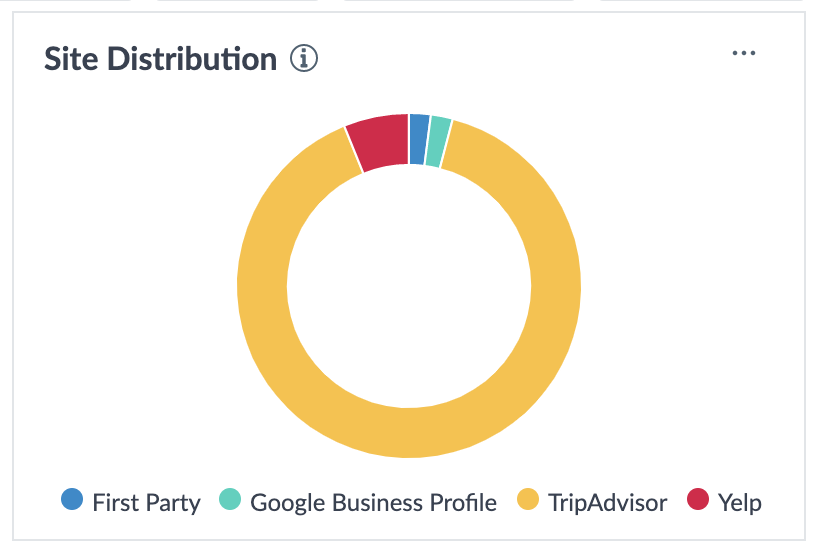
Site Distribution visualizes the sources of your reviews for the selected time period on the dashboard. Sources include first-party reviews as well as any review monitoring publisher (e.g., Google Business Profile, TripAdvisor, Yelp, and others). See the complete list of publishers that support review monitoring here.
Keyword Sentiment

Keyword Sentiment shows the sentiment score for individual keywords that appear in the reviews received during the selected timeframe on the dashboard. Scores range from -1 to +1.
Keywords by Mention and Keywords by Sentiment
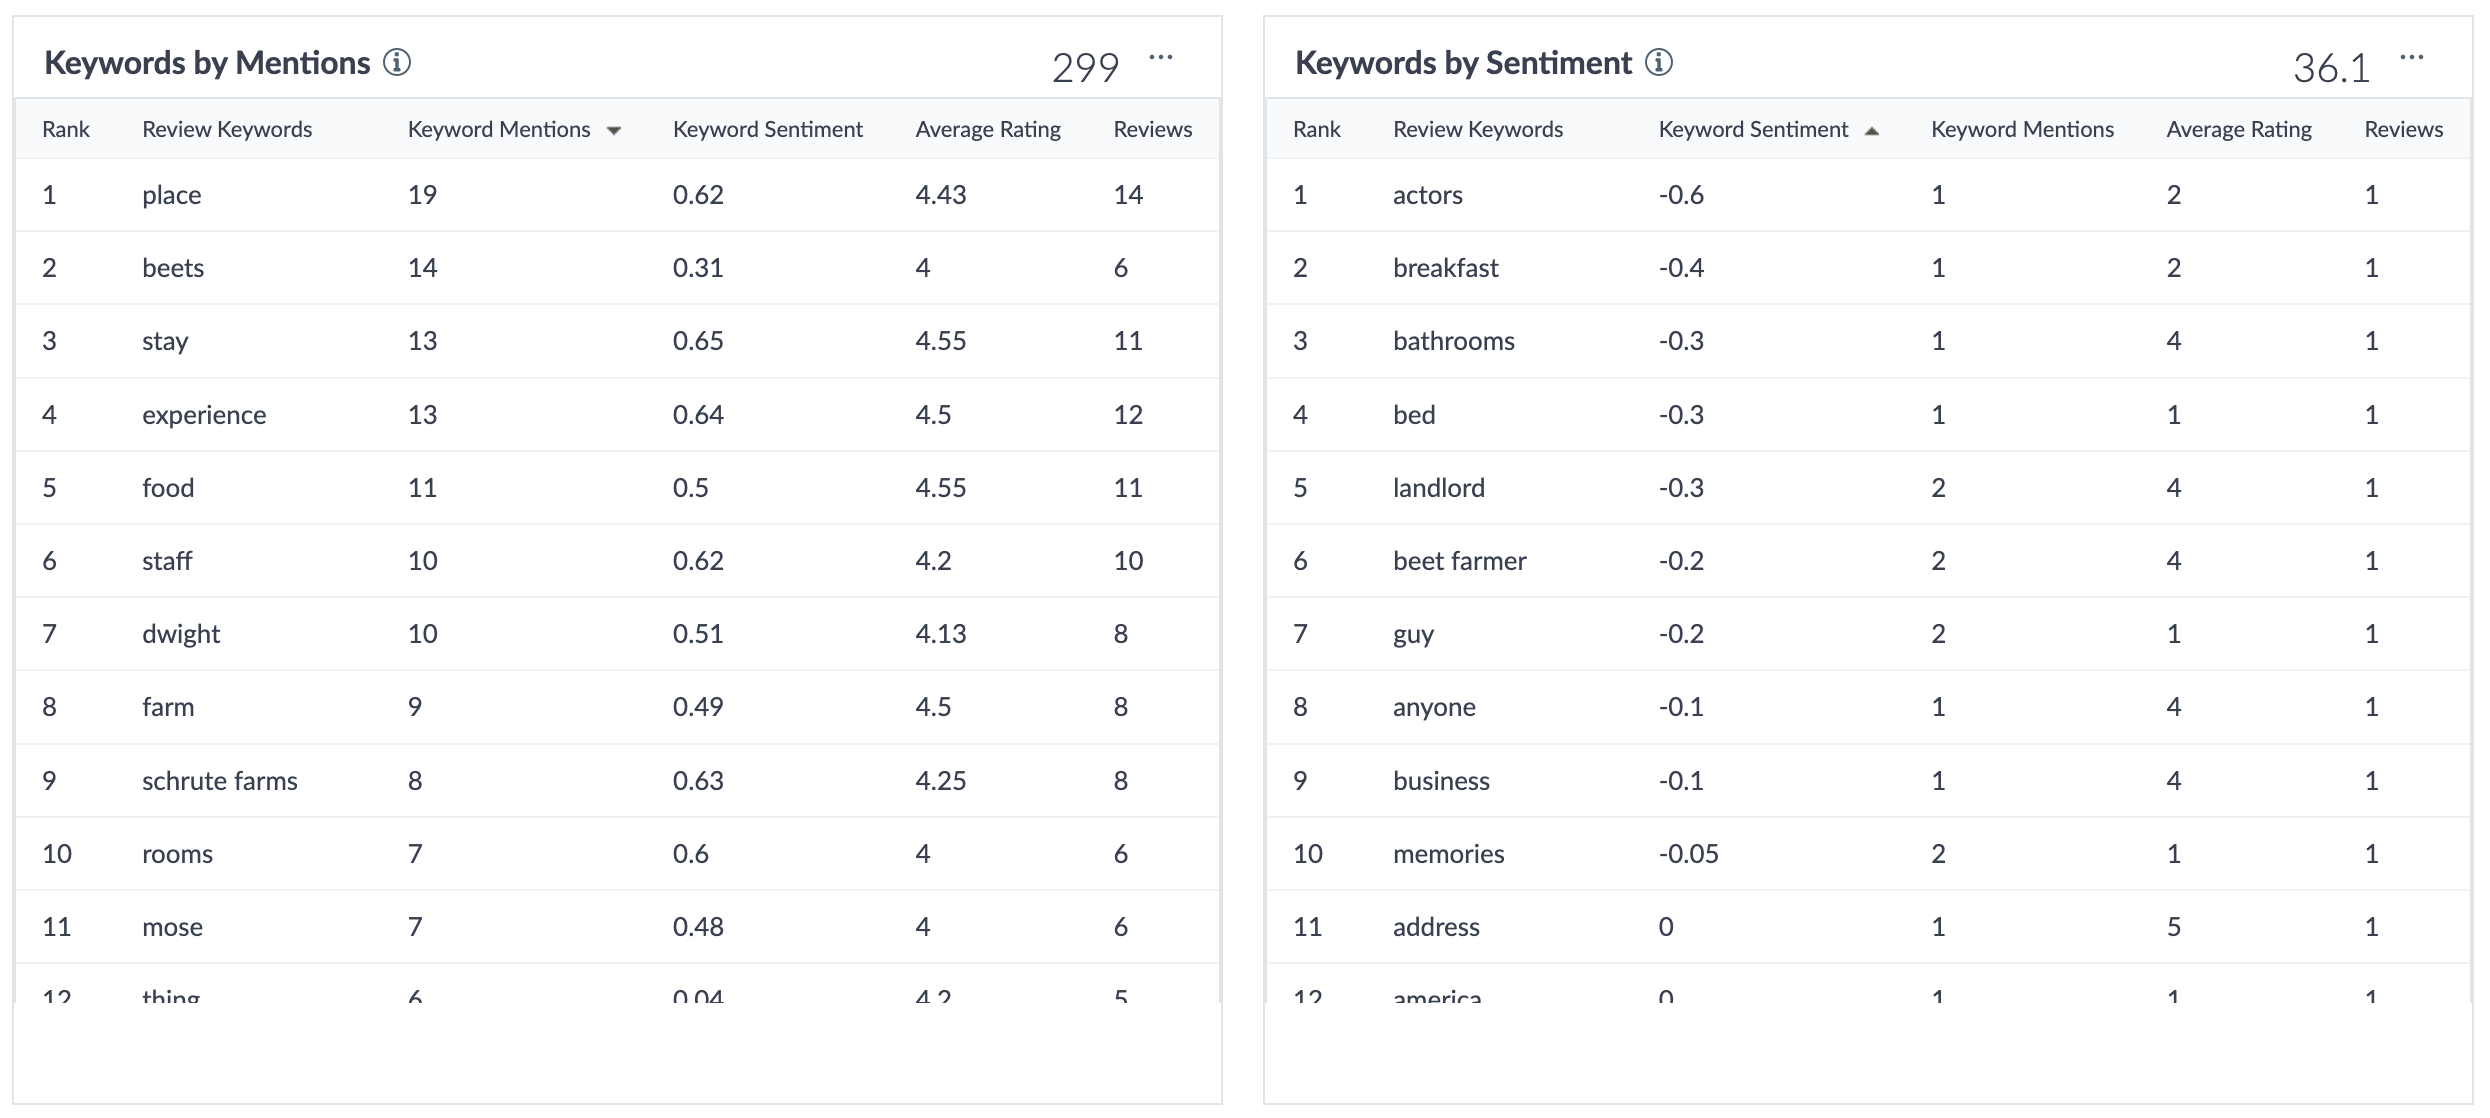
These insights display keywords that appear in reviews received during the selected timeframe on the dashboard, broken out in data tables. Both tables display the same data, but the Mentions table ranks keywords by how many times they are used in reviews, and the Sentiment table ranks them by sentiment score.
True or False: You cannot download the Reviews Summary metrics.
For a deep dive on review content and sentiment, the best place to look is:
Which insights are available by default on the Reviews Summary dashboard? (Select all that apply)
You're a star! ⭐

