
Listings Insights & Metrics | Yext Hitchhikers Platform
What You’ll Learn
In this section, you will learn:
- Ways to leverage Listings analytics in Dashboards and Report Builder
- How the watermark date affects Listings analytics
Leveraging Listings Analytics
Below we will go through how you can leverage certain metrics, and insights to understand more about your Listings, and how users are engaging with your brand.
Understand the State of Your Listings
One thing you can do is gain insight into your Listings as a whole to understand what is going on in the search ecosystem. You can get a sense of the work that Yext does to monitor your Listings, as well as to understand the entities in your account and Listings that are synced.
To do this, you can create a dashboard with the Listings Overview insight.
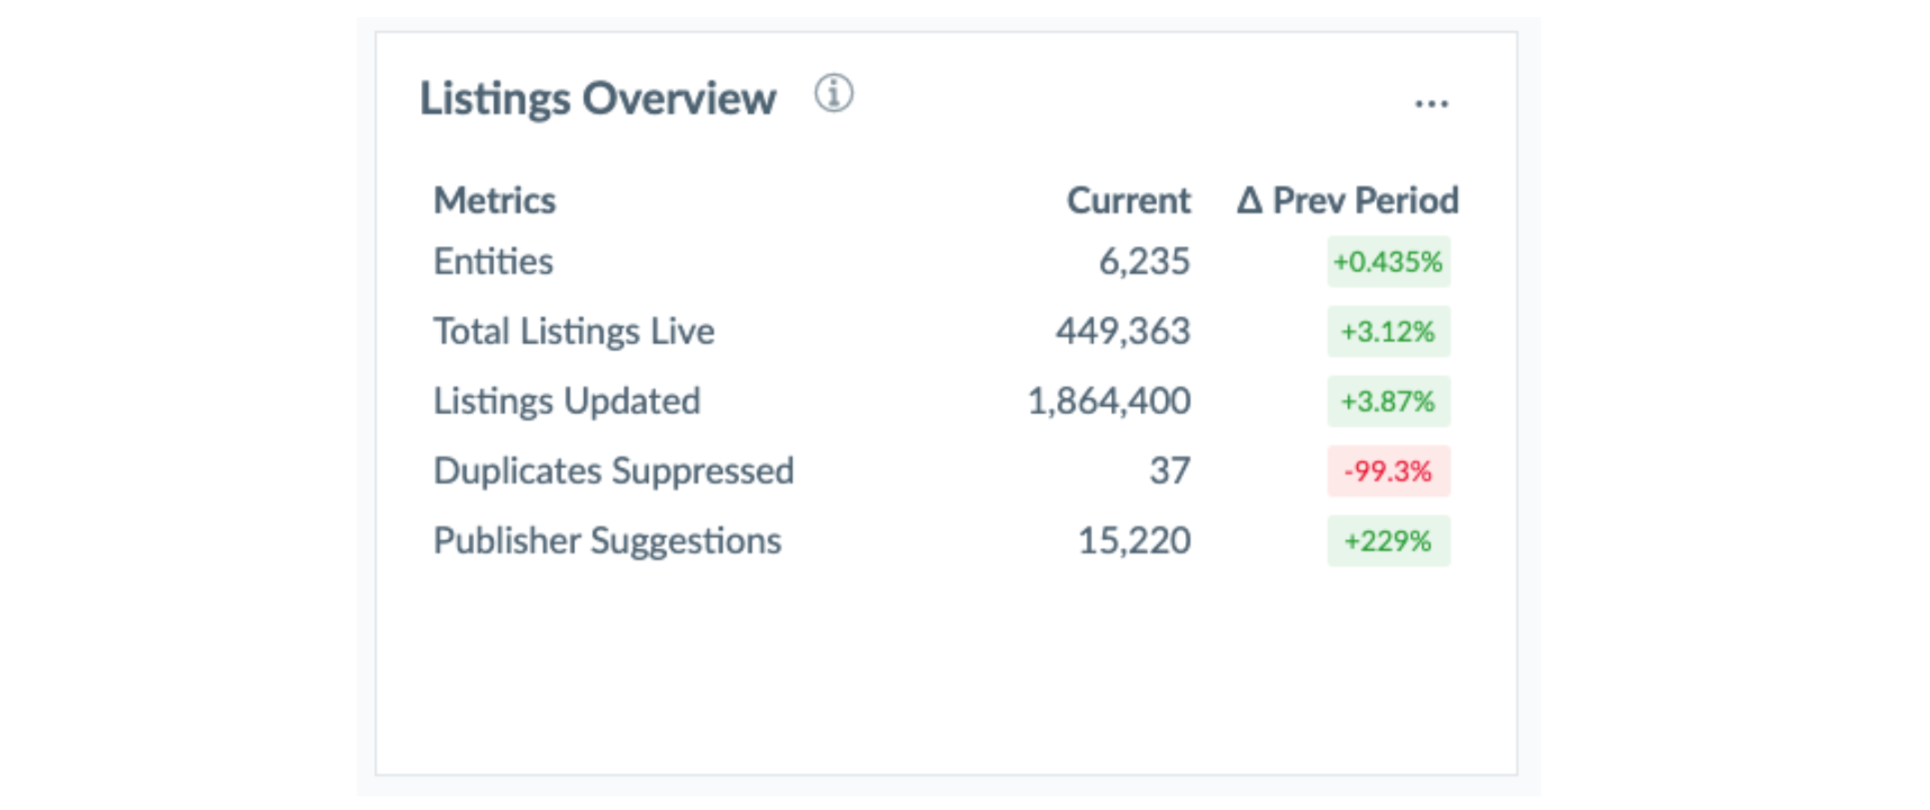
This will have data including:
- Entities: All entities in the account
- Total Listings Live: The number of listings that are Synced.
- Listings Updated: Listings updated during the time period.
- Duplicates Suppressed: Duplicate listings that were suppressed during the time period.
- Publisher Suggestions: Publisher Suggestions Received during the time period.
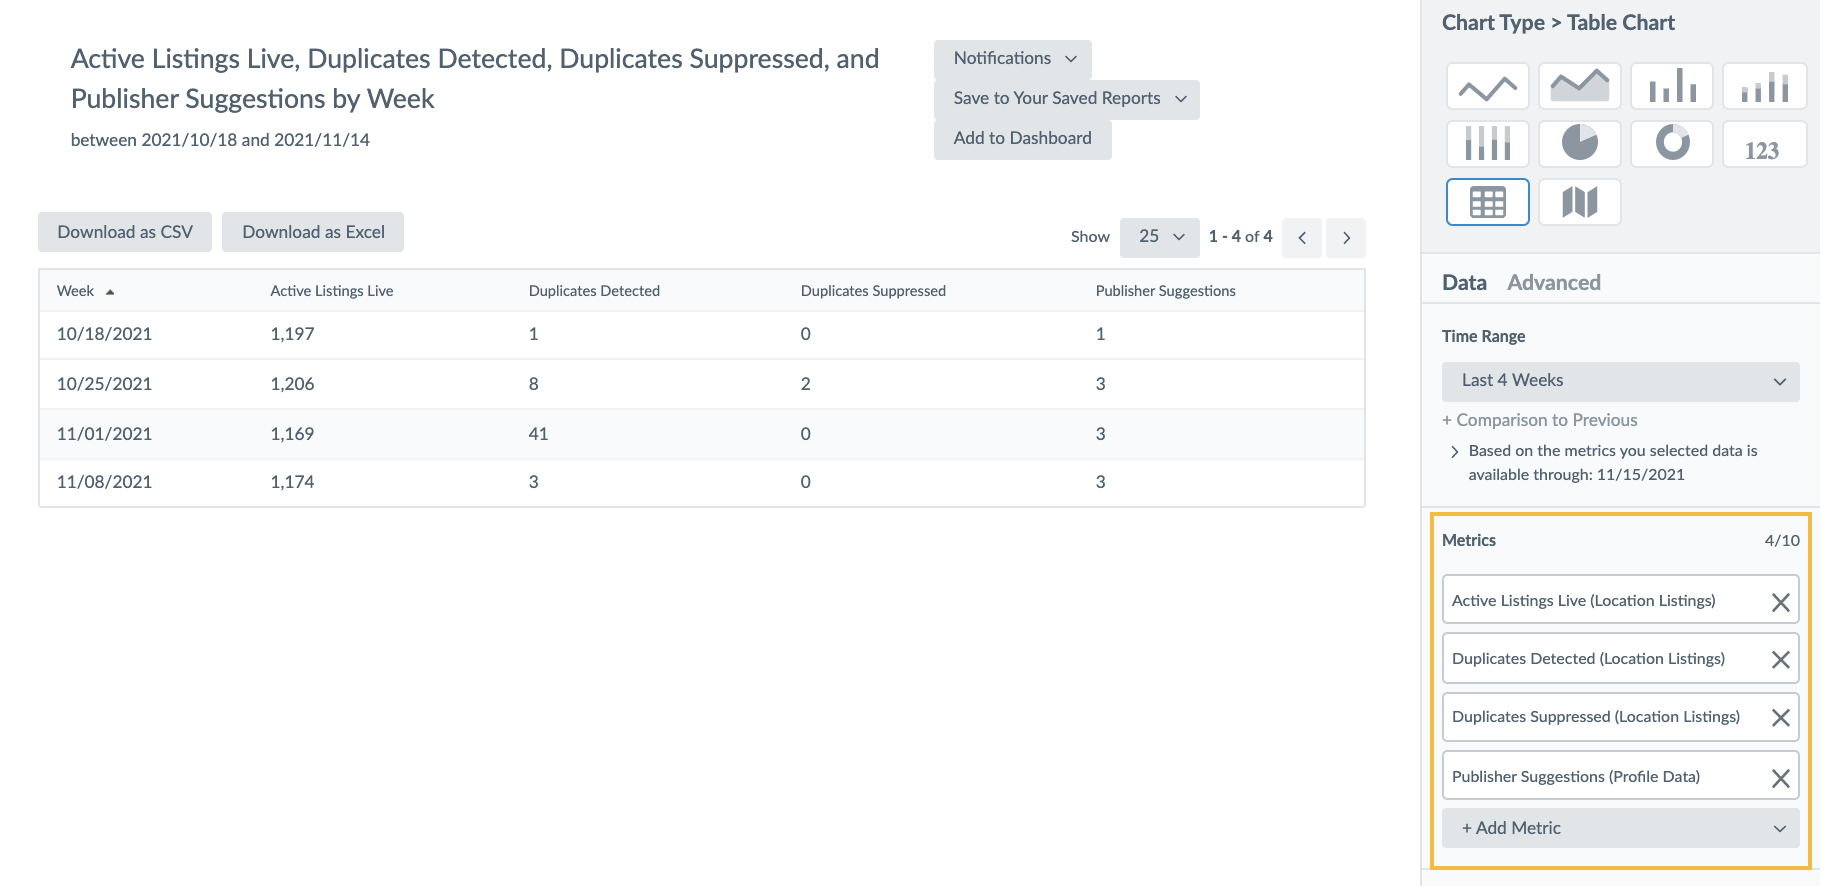
If you wanted to dig deeper into this data, you could also build a report in Report Builder pulling from a series of Location Listing metrics including:
- Active Listings Live
- Duplicates Detected
- Duplicates Suppressed
- Publisher Suggestions
Understand how Customers are Interacting with Your Brand
There are a series of metrics that you can use to understand how customers are interacting with your brand, and where they are finding you. For example:
- Google Listings Actions
- Google Listings Impressions
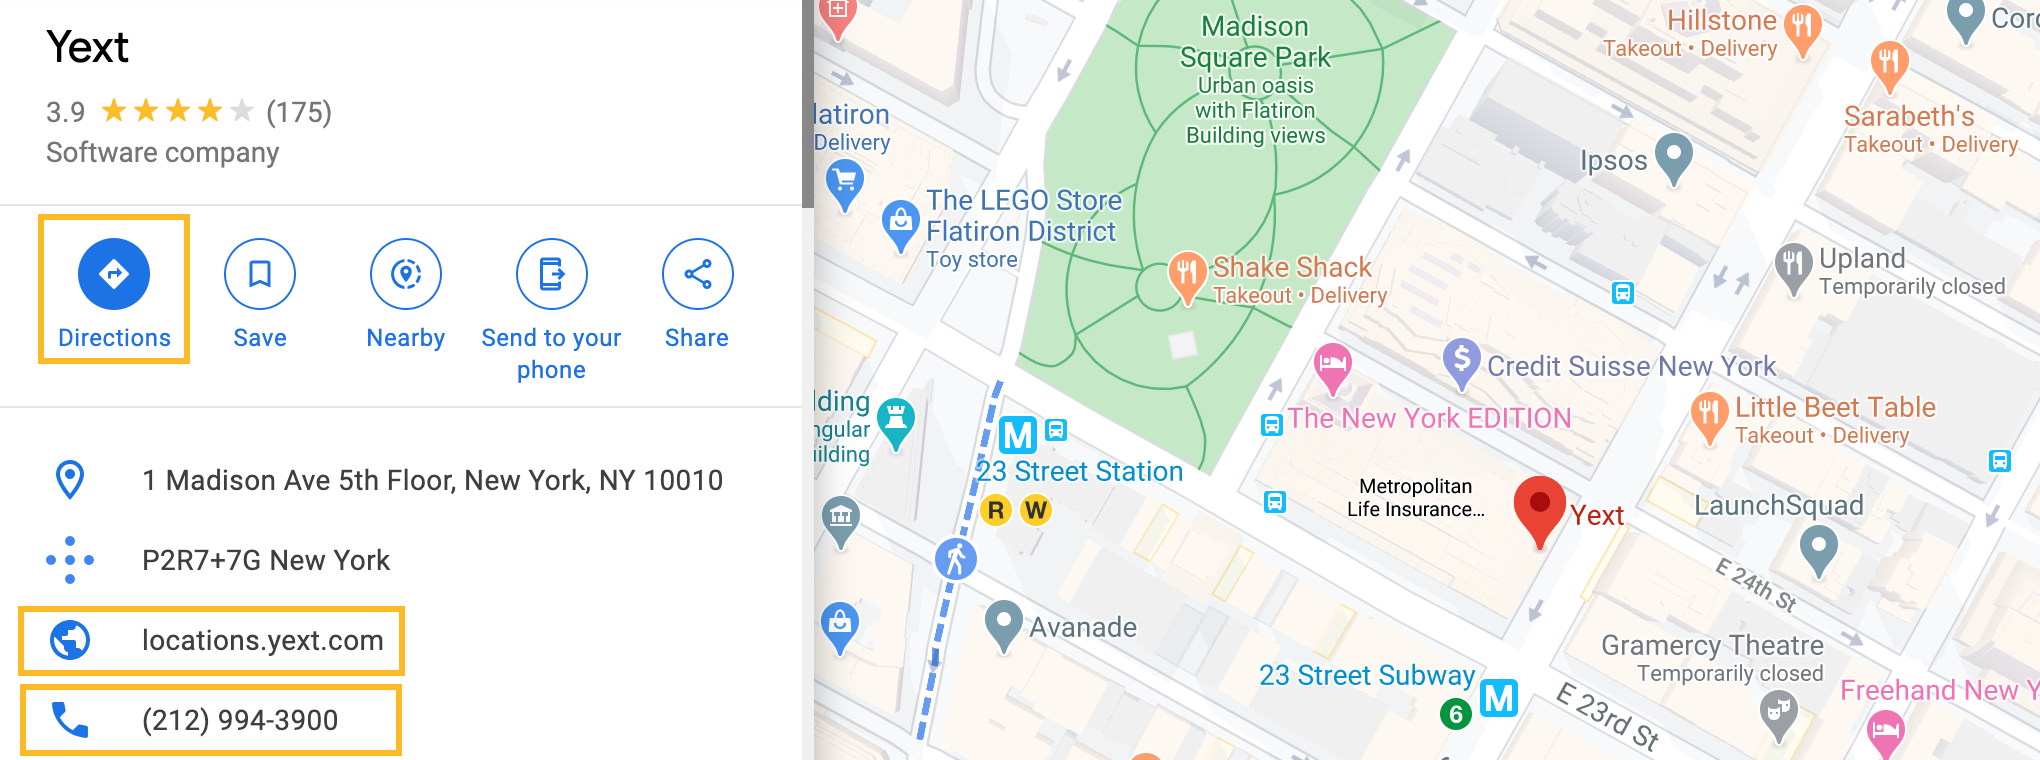
In this scenario, when your listing appears in a Google search, it will count as a Google Listings Impression. From there, Google Listings Actions will record actions such as when the user clicks on the ‘Directions’ button, a link to your website, or a click-to-call.
Similar engagement metrics are also available for Apple. For more information, see Apple Analytics .
Understand How You’re Being Found
The Google Search Term Impressions metric provides insight into the number of times search keywords were used to find your business in Google search or maps.
To see this, you can add the Google Search Term Impressions insight to your Dashboard.
Understand the Accuracy of Your Listings
In addition to checking the accuracy of your listings on the Listing Detail Page , you can track the accuracy over time using a metric in Report Builder.
Every publisher has its own rules and processes for receiving and displaying data on its site, also known as Publisher Transformations. The metric used to determine the accuracy of your listings is called Listings Accuracy, or the percent of fields with accurate data on Listings. “Accurate” means an exact match to the entity data stored in the platform, while also taking publisher transformations into account.
The Listings Accuracy metric is calculated by taking the number of fields (within the given filtered and dimensioned set of data) with accurate data divided by the total number of fields (within the given filtered and dimensioned set of data).
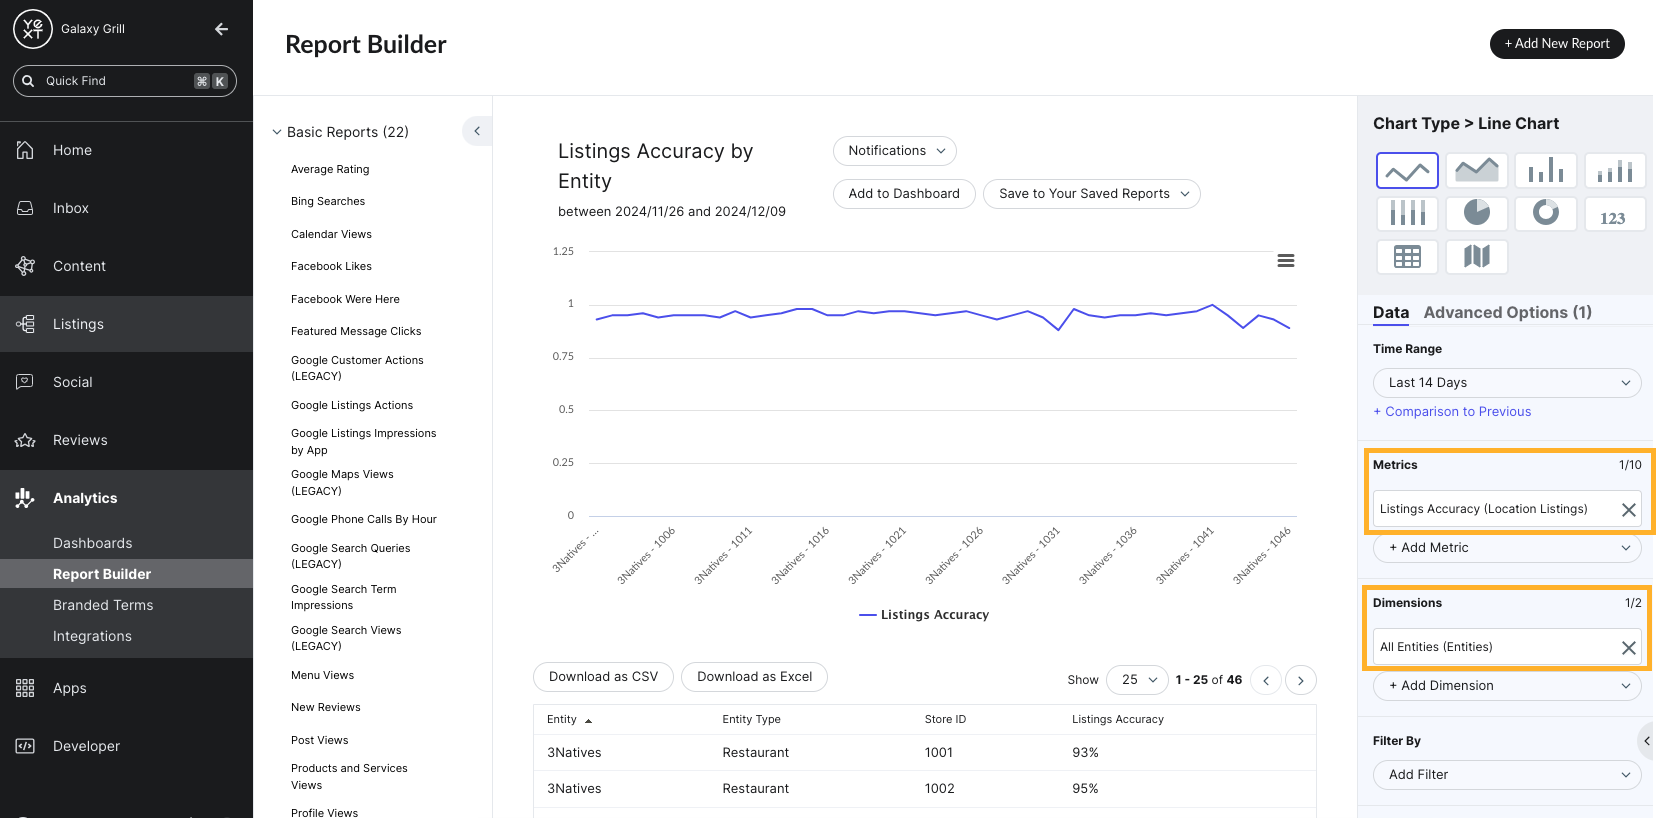
To use this metric, click Analytics in the navigation bar and click Report Builder. Remove all of the metrics and dimensions. Click + Add Metric, hover over Location Listings, and select Listings Accuracy. Then select your desired dimension from the following options:
- Entities: Listings Accuracy by entity
- Country
- Entity
- Entity Groups
- Entity Types
- Folder
- Labels
- Time: Listings Accuracy over time
- Days of Week
- Days
- Hours
- Months
- Week Number
- Weeks
- Listings
- Listing Field: Listings Accuracy by field supported on the publisher listing
- Sites: Listings Accuracy by a specific publisher
For more information about checking the accuracy of your listings on the Listing Detail page, see the Listing Detail Page unit. For a quick reference, see the Listing Accuracy reference documentation.
Analytics Watermark Date
Analytics dashboards and reports display the latest date that data is available through for each data source and for the dashboard or report as a whole. This date is called the watermark date.
Before you have access to analytics data from our publisher network, the data must go through two rounds of quality assurance: first by the publisher, and then by Yext. These review processes are to check for any irregularity or inconsistency before the data is shared to customers.
The QA process ensures the data we share is of the highest quality. QA time can vary between publishers, so watermark dates for data may differ slightly across publishers. For example, Google Business Profile data is reliably high quality and very important to many Yext customers, so this data is usually available with little to no lag time.
To learn more, check out the Custom Report Builder and Custom Dashboard units.
Why might you choose to leverage the Listings Overview insight?
Which of these insights is the best to use in order to understand how your listings are being found in search?
True or false: All Listings analytics are displayed in Yext as soon as they are available on the publisher.
What does the watermark date on analytics refer to?
High five! ✋
