
Debug the Frontend | Yext Hitchhikers Platform
What You’ll Learn
By the end of this unit, you will be able to:
- Explain the two main ways to debug the frontend
- List at least three common frontend issues
- Identify and resolve a syntax error in the Code Editor
Overview
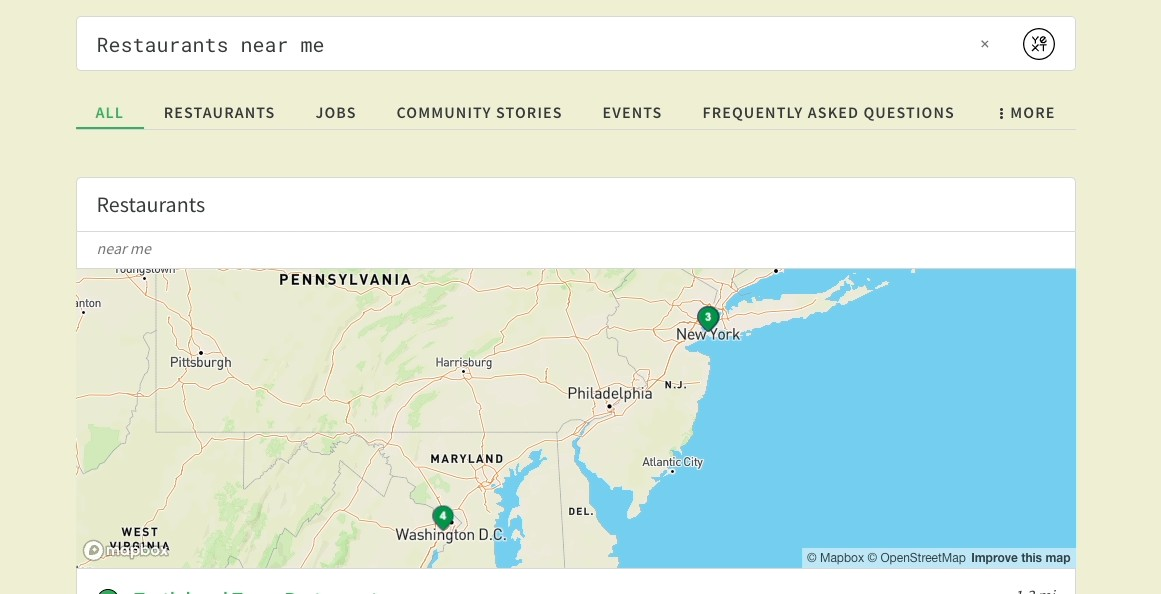
Remember that if you see an issue with the quality of your search results (i.e. what results are returned and the order they are returned in), you’ll want to debug the backend . When you notice display issues on a Search page, you’ll want to debug the frontend. You can debug the frontend using Live Preview, a deploy preview link, or on a staging link in order to see if there are any visual issues or errors (you can technically debug from the production link as well, but as you’ll learn, you’ll want to QA as much as possible before publishing to the production branch). It’s possible that your recent build or preview has produced some funky results on the frontend, like the below:
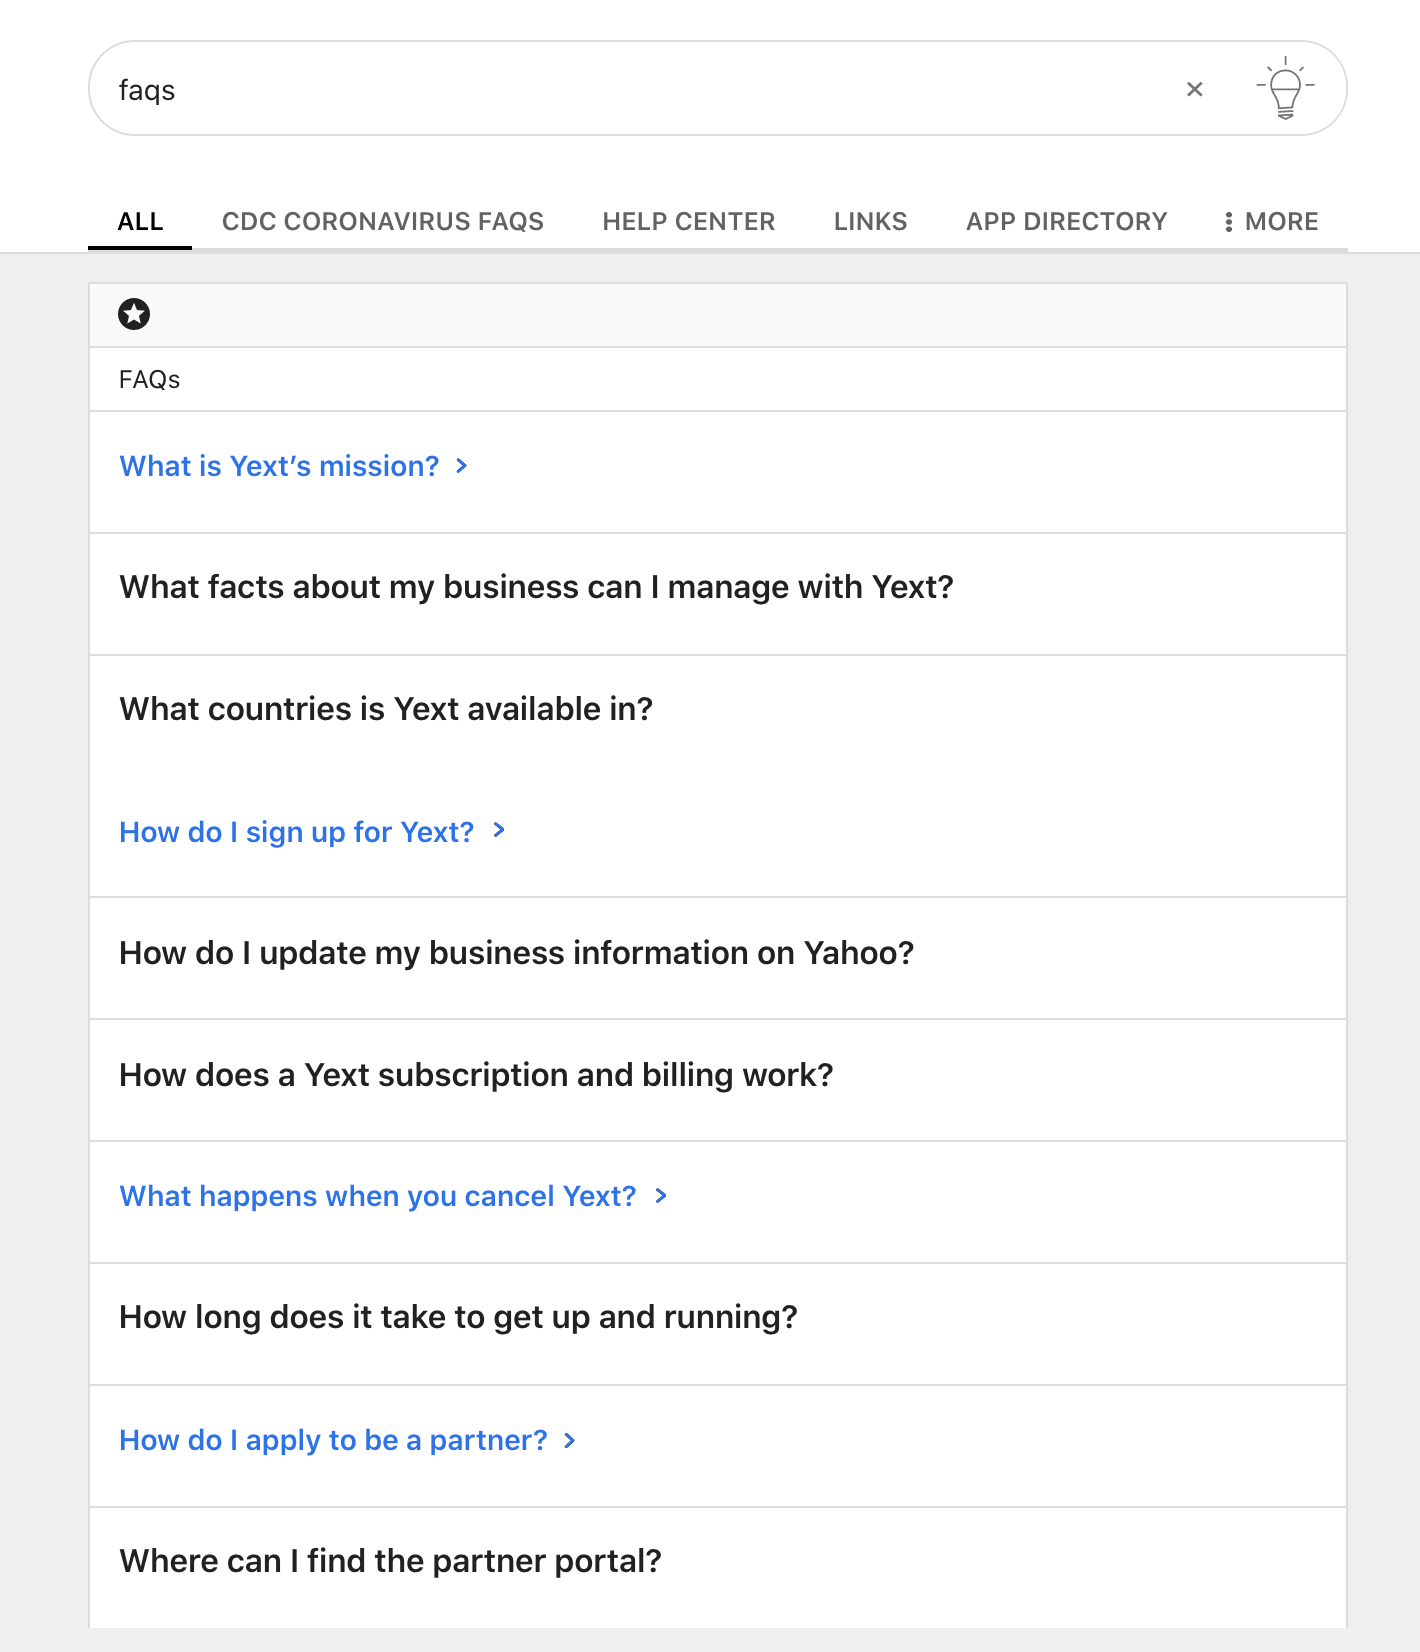
If we see something like this, we automatically know that there is a frontend issue. Here the FAQ vertical is not using the accordion card type (which isn’t typical of FAQ cards) and the vertical is also missing a “FAQs” section title. This is a signal to check the frontend files, where you configure your verticals and data mappings for the experience.
There are two ways to debug these types of issues which we will talk about in this unit:
- Inspect the frontend to review error messages for the page or component using the browser inspect tool
- Review the Code Editor and Console to look for Jambo error messages and syntax error indicators
Common Frontend Issues
Some common issues to look out for when reviewing your frontend are:
- Vertical tabs are not appearing
- Vertical section titles are not appearing
- Vertical page is missing a meta title or meta description
- “View all” links lead to a dead page
- Entering a search query produced a blank page
- Data mappings are not appearing on the card (note: this could be a frontend card mapping issue or backend API issue)
- You see a bunch of horizontal gray lines instead of result cards (this means the cards can’t be shown so you’re seeing a bunch of blank cards)
Inspecting the Frontend
Use the browser’s “inspect” functionality to identify if you have a frontend issue. Right click on a page, select Inspect and then navigate to the Console tab. If you have issues with the frontend JavaScript, they’ll show up in the console section in red:
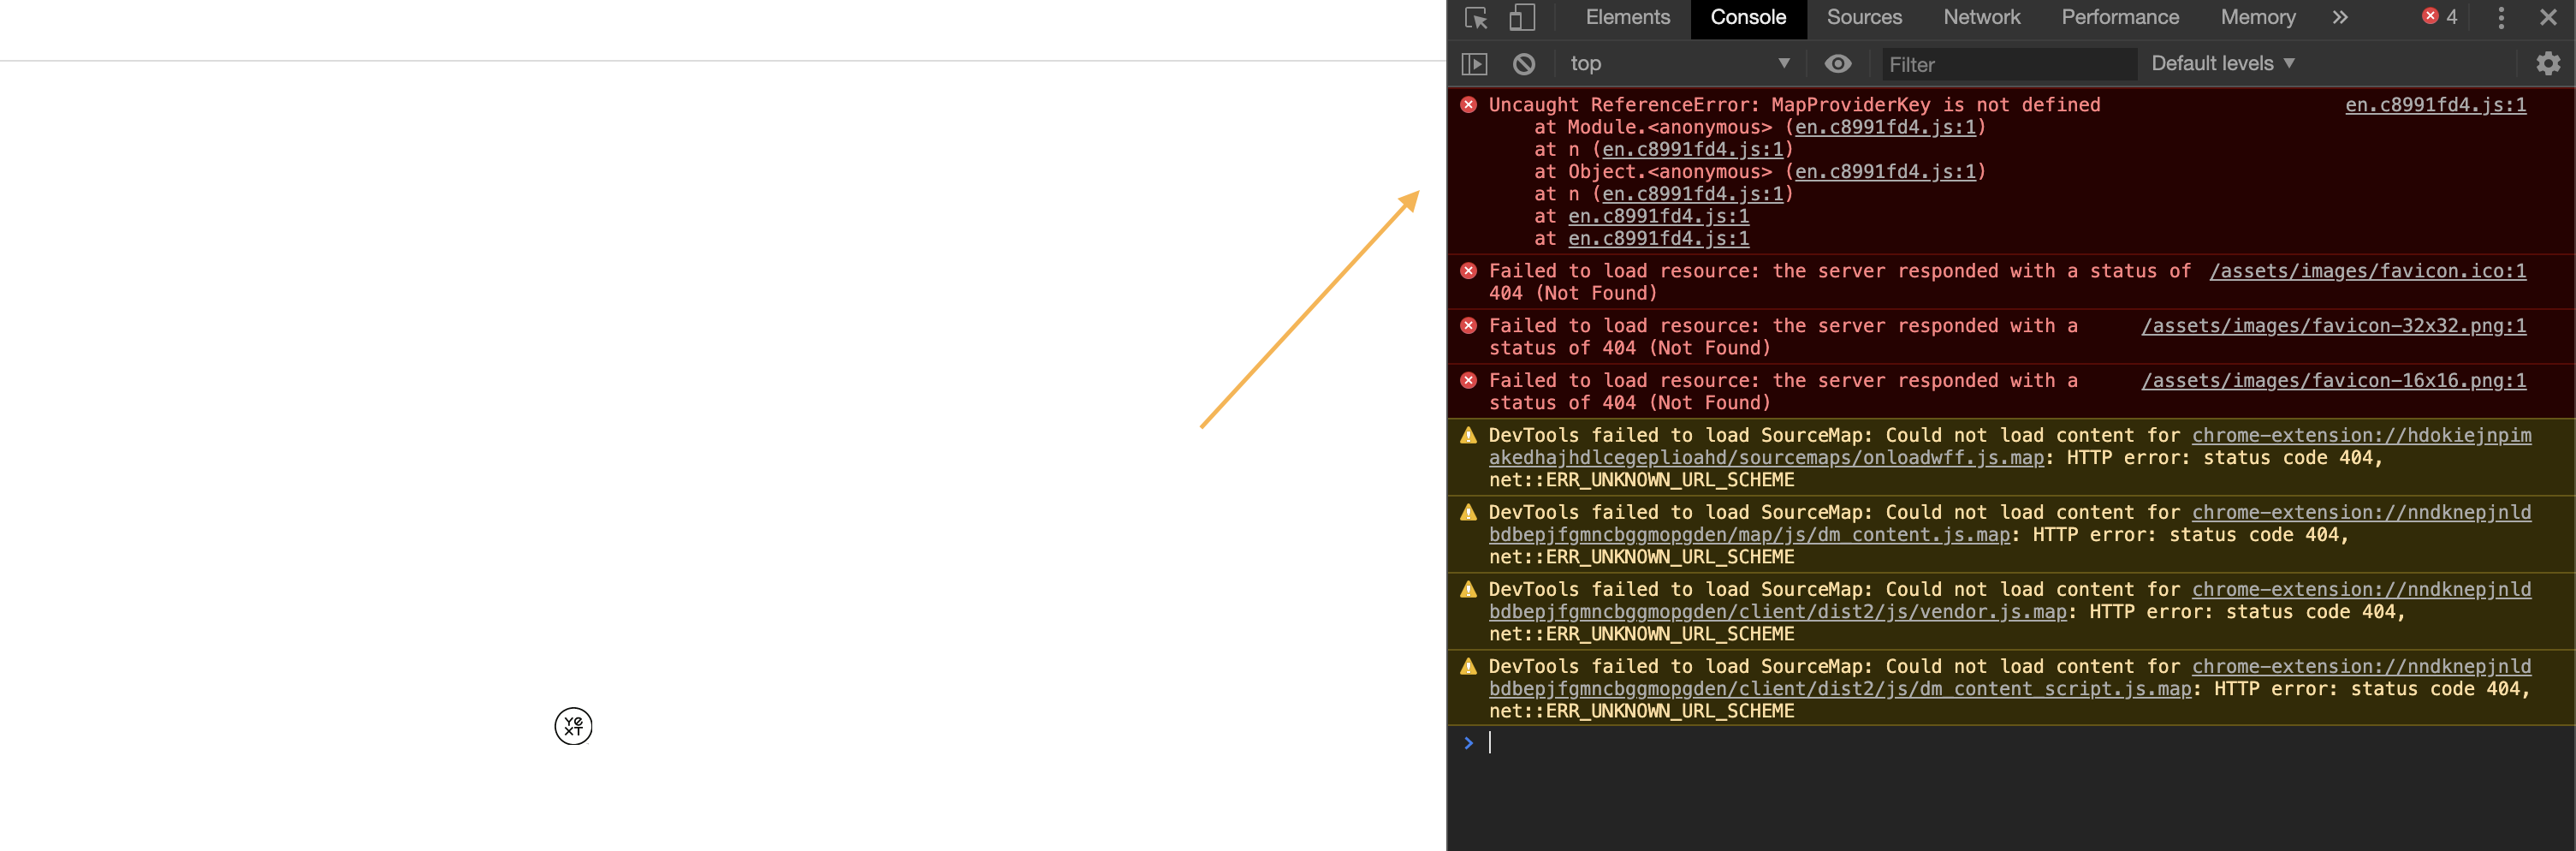
In this example, the blank page produced a console error. You can usually determine the issue type within the console error itself. In this example, the error reads: “MapProviderKey” is not defined. Therefore, you can infer that there is an issue with the Maps API Key and troubleshoot from there.
Section on Card is Blank Example
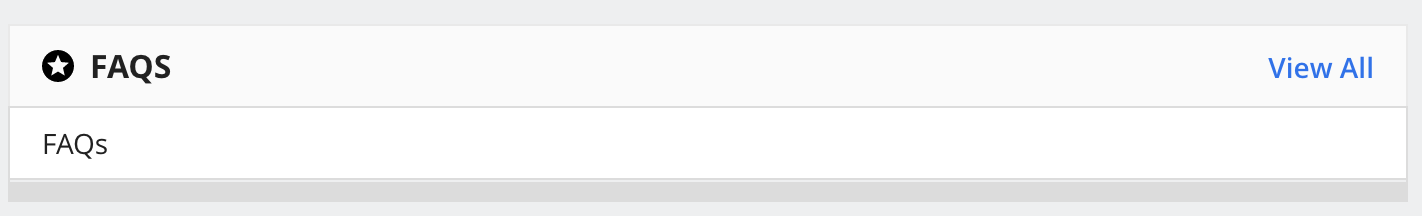
A section on a card appearing blank usually indicates a poorly mapped section on your card. Common reasons this might occur:
- You’re incorrectly mapping to a field - ex. forgetting to include the
profile.before a field, or omitting thec_for a custom field. - You’re incorrectly referencing a formatter name
- You need to null-check a field that might have an empty value
- You’re incorrectly referencing a card
In this case, we can see that the card name likely isn’t being referenced properly in the cardType object of the pages config file through the following error message:
Debugging with the Code Editor and Console
As you learned in the Navigate the Code Editor unit, the console is a great tool to help resolve frontend errors.
As you write code, the code editor will show you issues in your code with red underlining and red indictor to the right of the affected code line. This will help you identify syntax related issues such as missing a , or not completing parentheses ().
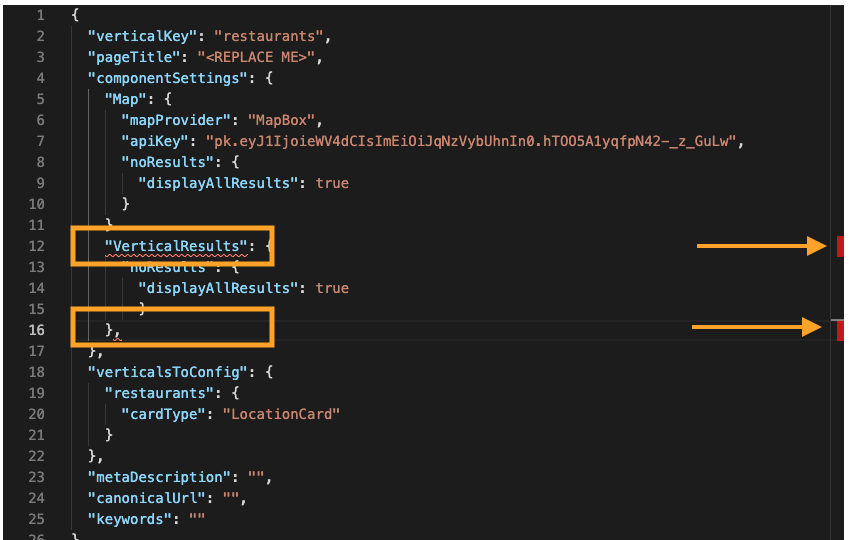
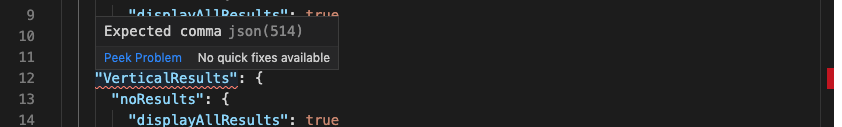
Hover over the red underlining to see error messages that note syntax errors such as unexpected characters or incorrect field references for data mappings within your files. In the example above, VerticalResults is underlined because it’s expecting a comma to separate the object that comes before it. The comma on line 16 is underlined because it is extraneous.
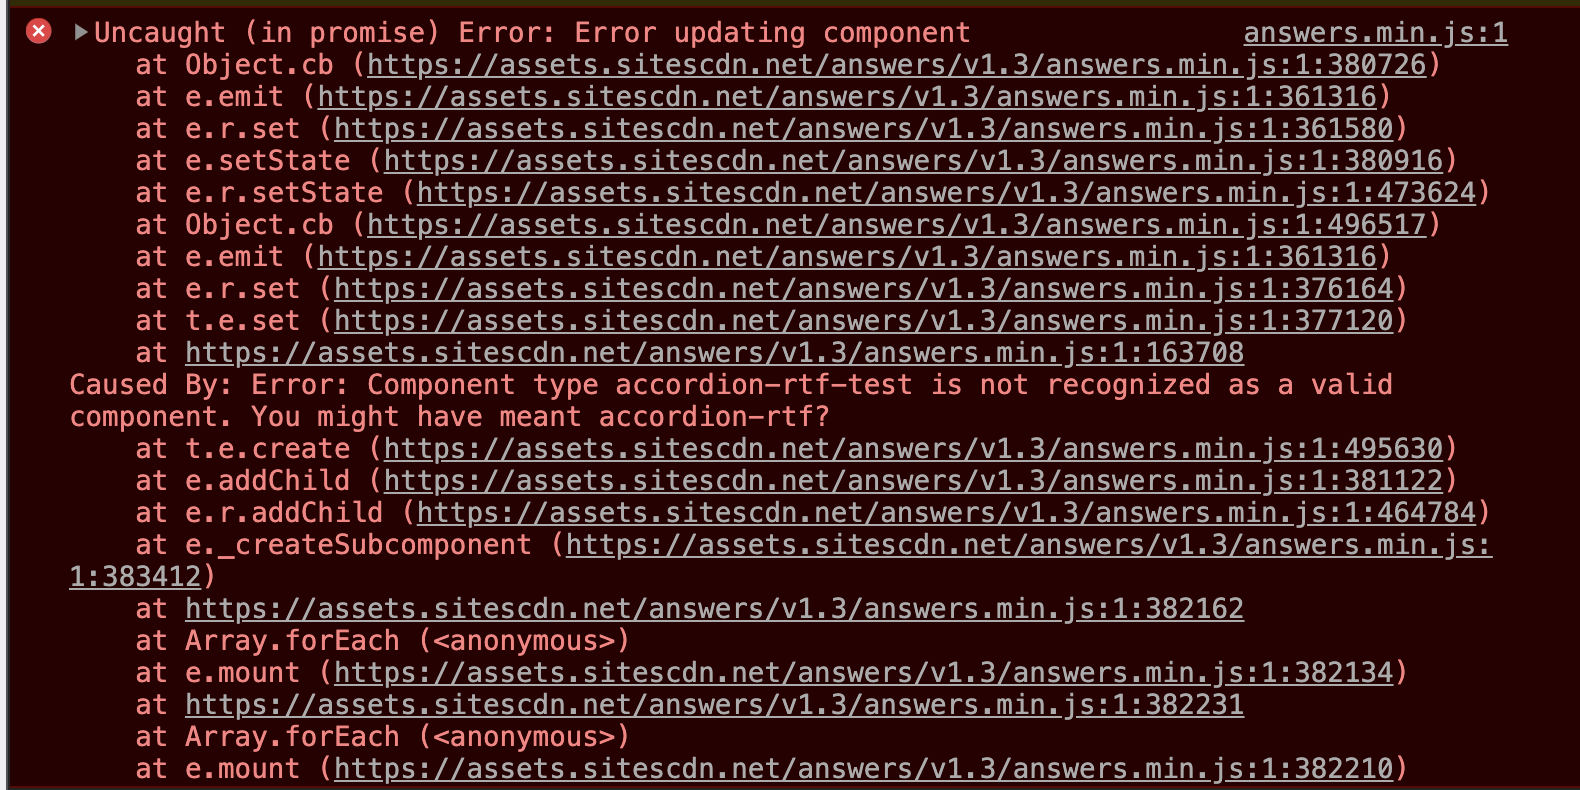
Page Components Aren’t Visible Example
If your experience is coming up as blank or components aren’t rendering it is likely due to a syntax error within the Code Editor. We can look to the console to see where an issue or typo may have occurred. This is particularly useful if you have made a lot of changes in a single session.
In this case, you can see the error message notes an “Unexpected token ,” in the faqs.json config file. Once we remove it, the page will render properly.

To see common console errors and what they mean, review the Common Console Errors/Definition - Debugging reference document.
What is the benefit of inspecting and looking at the console for frontend debugging?
True or False: If you identify a frontend issue, the first place to go is your Search configuration file, because it is what controls the look and feel of vertical pages and card types.
Wahoo - you did it! 🙌
