
Search Analytics | Yext Hitchhikers Platform
What You’ll Learn
By the end of this unit, you will be able to:
- Name the three buckets of key value drivers
- List key metrics you can find in Report Builder for Search
- Recall common examples of reports
Overview
In the last unit, we took a deep dive into search terms to see what your users are searching for, what their intents are, and how we could pull trends from them. In this unit, we’ll take a step back to look at Search analytics more broadly.
When reviewing analytics, it’s important to keep your key value drivers in mind, so you can measure current performance and trends for them. We use three buckets for key value drivers for any search experience:
- Revenue generation: Driving more clicks and conversions
- Customer intelligence: Gaining insight into what users are searching for
- Cost savings: Reducing support costs
You can utilize the Search Analytics metrics available in the platform to measure success in each of these areas. You can tailor the actions you take to improve the experience to the key performance indicators for the brand.
For example, if you notice the click through rate is low for a given query or set of related queries, you could update the CTA (or add an additional CTA) for the vertical containing results associated with that query. You could then track the effect of this change on Click Through Rate over the next few weeks and compare it against the click through rate from the previous period. This change is an example of identifying a trend in analytics metrics and taking action to drive more clicks and conversions through the experience.
Search Analytics in Report Builder
In Report Builder you can build your own reports using built-in Search metrics, dimensions, and filters. You can shape the reports to fit your needs and how you want to measure what a successful search experience means for you. Check out the Report Builder module to learn more.
To use Report Builder, navigate to the Analytics > Report Builder. From this screen, you can select various Search Analytics metrics under the “Metrics” drop-down. Check out the Search Metrics reference doc for a full list of available metrics.
Once you’ve selected the metric(s) you’d like to include in your report, you can select the type of chart you want to see and update the remaining variables, such as time range, dimensions, and any filters or sorting to be applied.
For example, we could build out the search trends over time chart so that we can dig deeper into the trends. Below we’ve created a week over week comparison of key metrics (you can also dimension time by days, but this shows weekly patterns rather than daily fluctuations). Note that the start of the week is set to Mondays by default.
To set up this report:
- Chart Type: Line Chart (for a visual representation) or Table Chart
- Metrics: Searches, Search Sessions, Search Clicks, Search Click Through Rate, Conversion Value
- Dimensions: Weeks
Filters: Configuration Version Label: Production, Traffic Type: External
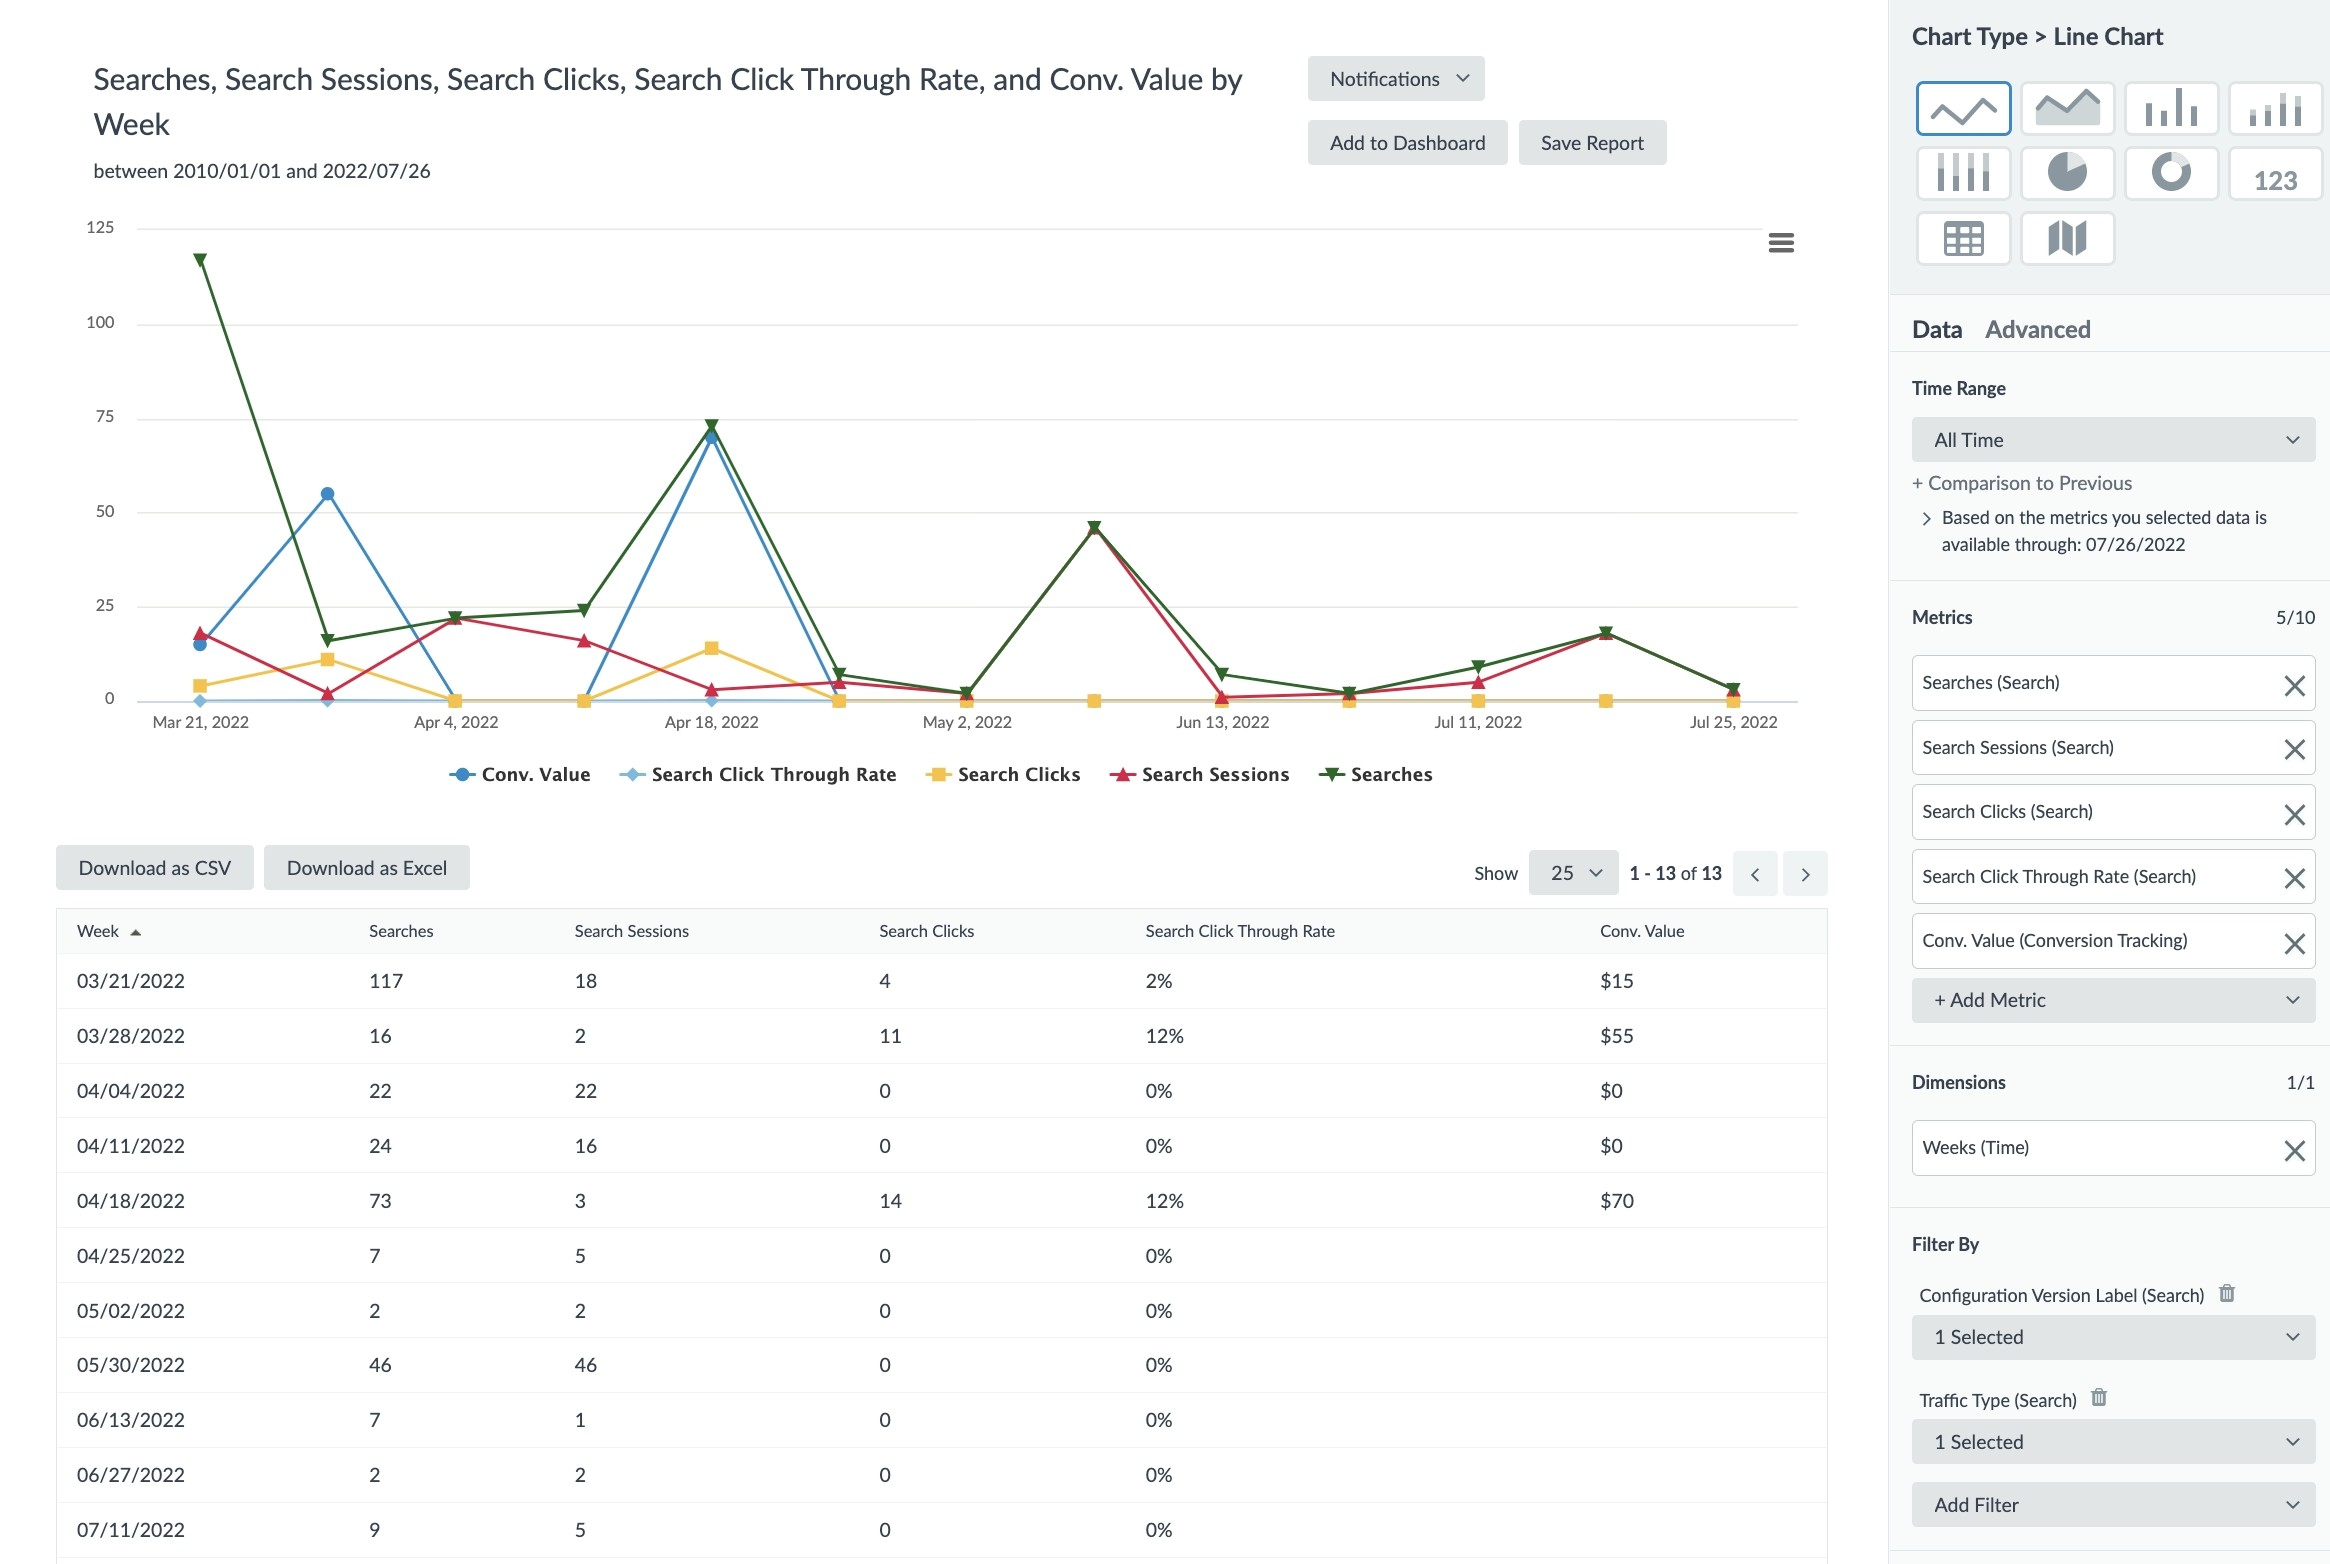
The production and external traffic type are both important filters to use so that you can exclude any searches conducted by internal users while building and testing the Search experience.
From here, you can dive deeper into the report. Perhaps you are interested in how the Search is performing in a specific geographic region or how it differs based on the integration method used. These are both dimensions and filters you can add to your report.
For more examples of common Search reports in Report Builder, check out the Common Search Analytics Reports reference doc.
Segment Analytics Further
There are many built-in ways you can segment your data using dimensions and filters. Here are some ways you can make changes to these segments:
- Internal Traffic Type: mark IP addresses as internal (check out the Internal Traffic Type reference doc)
- Event Types: change to a different built-in event type (check out the Search Analytics Event Types reference doc)
- Visitor Analytics: track how individual users are engaging with your search (check out the Analyze Trends with Visitor Level Analytics guide)
What are the three key value drivers for Search?
What are some examples of Search metrics found in Report Builder? Select all that apply.
What filters will you typically want to turn on for Search Analytics reports? (Select all that apply)
A Hitchhiker in the making! 🔥
