
Table Insight Customizations | Yext Hitchhikers Platform
What You’ll Learn
In this section, you will learn:
- An overview of Leaderboards
- Leaderboard examples
- How to add icons to Leaderboards
- How to add sparklines to table insights
When creating your report, if you selected the Table Insight for your chart type you will see some additional customizations. The Table Insight allows you to create customizable data tables, such as Leaderboards.
Overview of Leaderboards
These Leaderboards allow you to easily monitor how each of your entities are performing across your entire organization. You can view your table in either ascending or descending order, and add time comparisons to see percent changes, rank, and change in rank.
How to Create Leaderboards
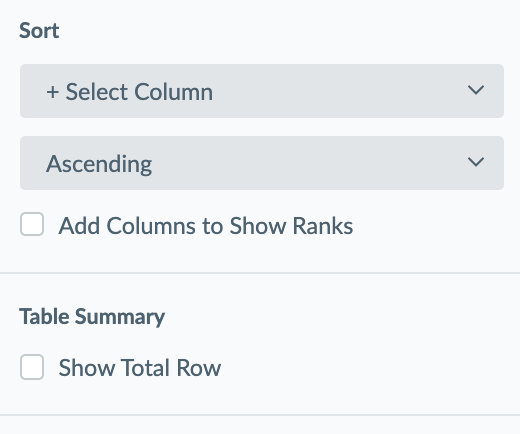
Once you’re editing a Table Chart insight:
- Click + Select Column and select the column you would like to sort by.
- Select Ascending or Descending sort order.
- Select the checkbox next to Add Columns to Show Rank to add ranking to the table.
To further customize the data you want to see, you can add a column for simple custom fields as well as fields stored in the Knowledge Graph. This capability is especially beneficial for brands that have the same business name across their locations, so they’re able to use a field like Geomodifier to sort their entities.
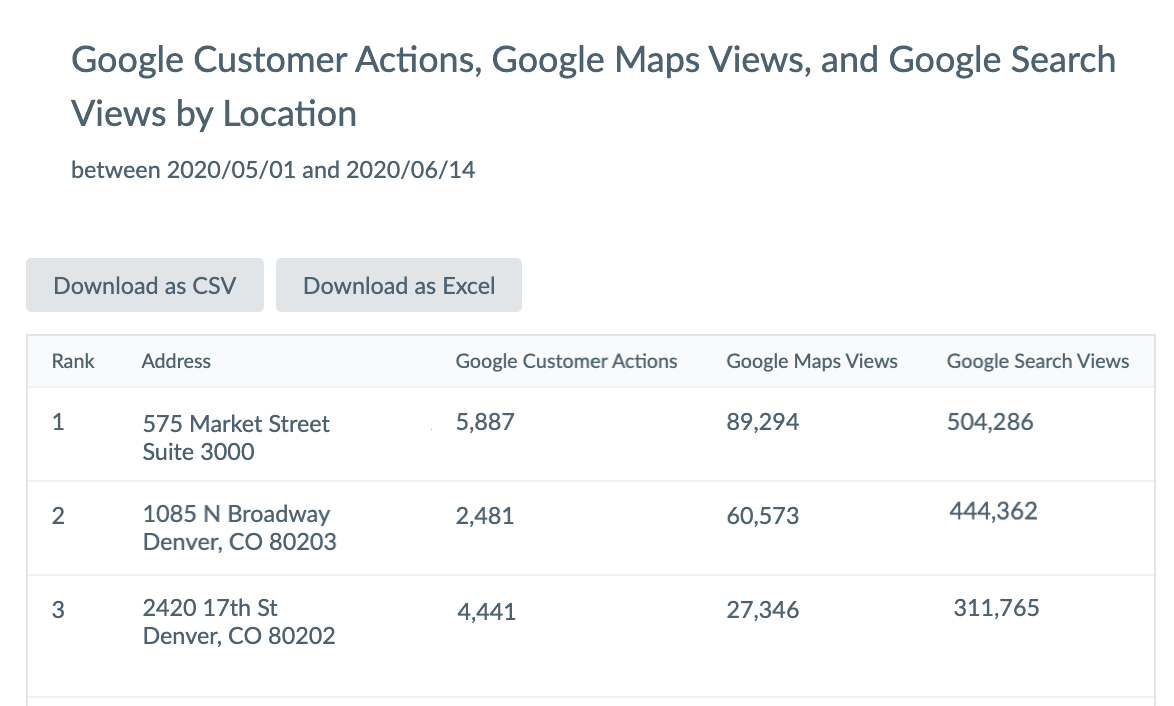
Leaderboard Examples
One way to use the Leaderboard is to showcase Google Customer Actions, Google Map Views, and Google Search Views to showcase the listings that have the most action taken.
Other Leaderboard examples include location leaderboards ranked by clicks, country leaderboards ranked by conversions, insurance agent leaderboards ranked by page views, etc. Understanding how well your entities are performing will help you identify which areas need more attention from a digital perspective, like SEO or additional paid ad spend.
Leaderboard Icons
To help you easily differentiate between multiple insight tables in a dashboard, you have the option to add a header icon to table insights. When adding an insight to a dashboard, you can choose from a preset library of icons.
![]()
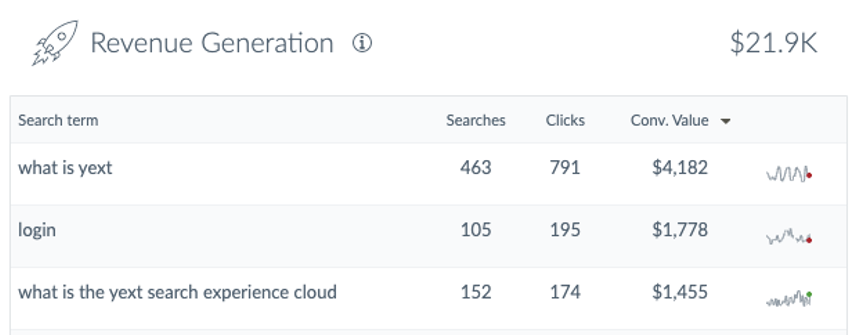
Sparklines
You can also customize your table insights by adding a sparkline to a column. A sparkline is a small line chart that provides a visual representation of data trends inline. Sparklines give you another way to view your performance, helping you to contextualize the metric values you are monitoring on your table insight. You can add sparklines to any insight that is not dimensioned by day (as sparklines are already a metric by day).
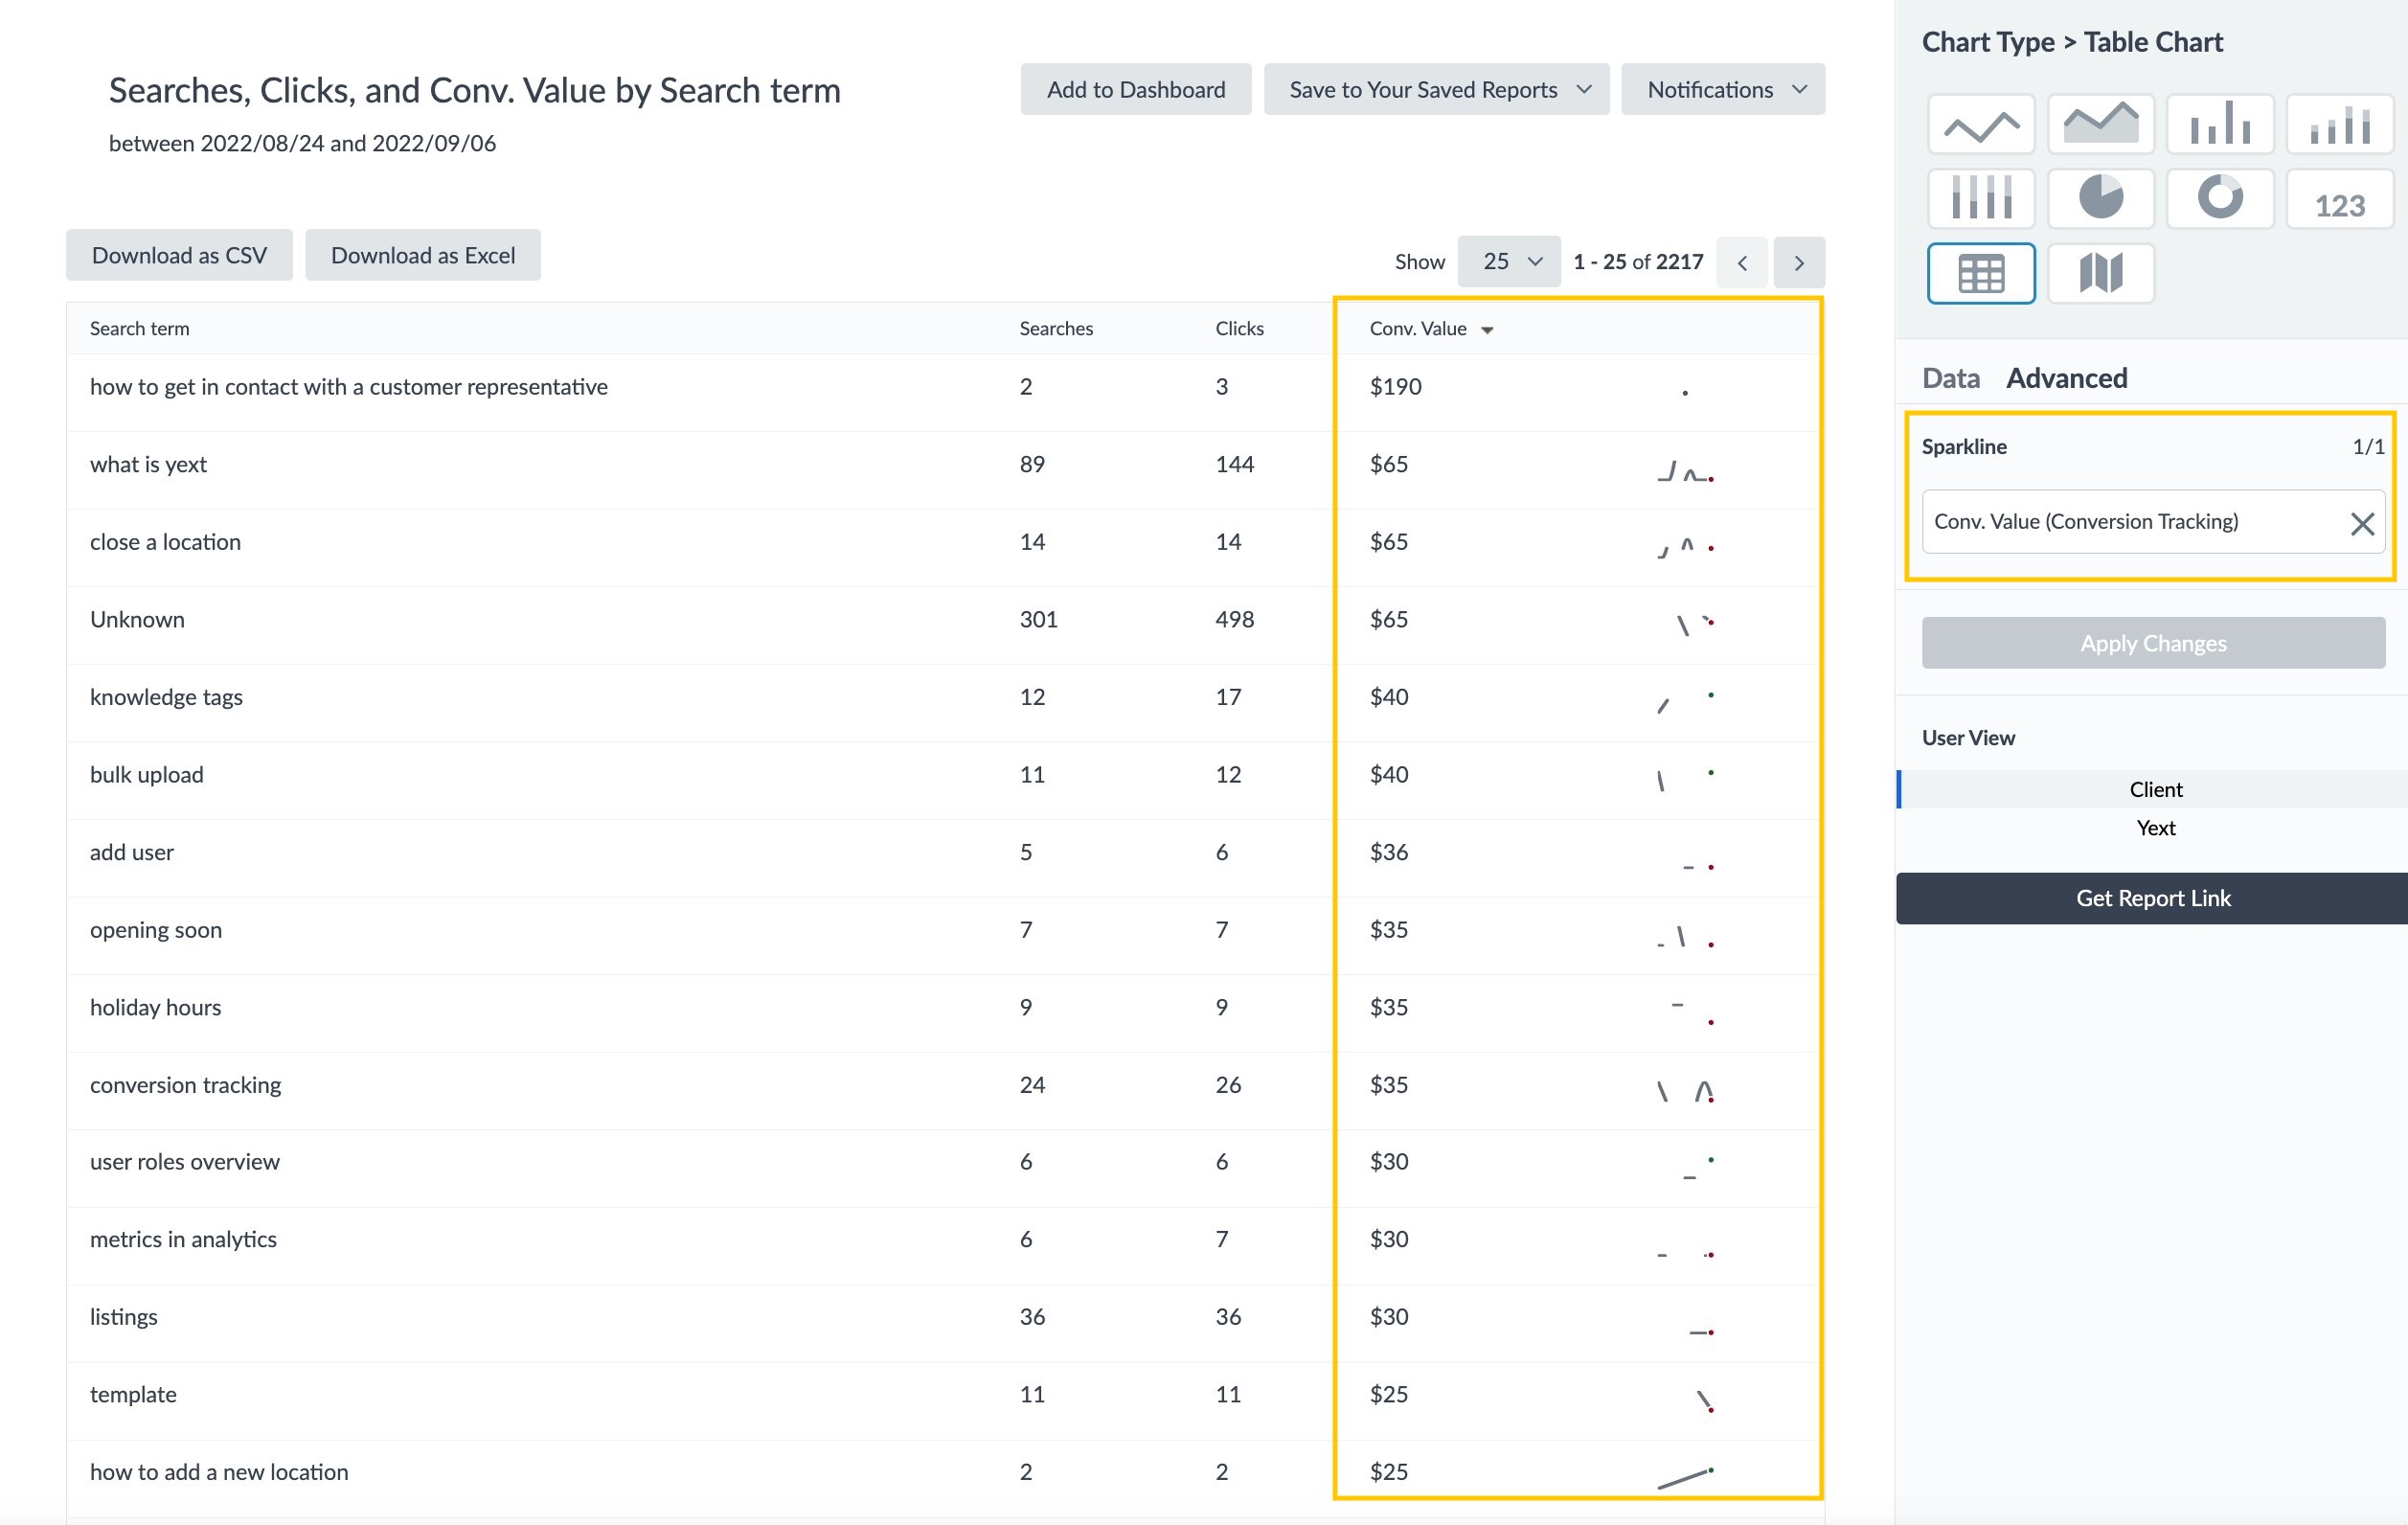
Once you’re editing a Table Chart insight, you can add sparklines by:
- Navigate to the Sparkline section under the Advanced tab.
- Pick the column(s) for the sparkline.
Sparklines will be rendered immediately to the right of the selected column(s) and will use the same time range you have set for the report or dashboard.
What is required in order to set up a Leaderboard? (Select all that apply)
Which of the following is a use case for Leaderboards? (Select all that apply)
Which of the following is a use case for sparklines? (Select all that apply)
Way to go, you passed! 🏁
