
Debug the Backend | Yext Hitchhikers Platform
What You’ll Learn
By the end of this unit, you will be able to:
- Describe the resources you have to debug the backend and what types of information you can get from each resource
- Navigate the platform to access these resources
- Demonstrate how to start debugging backend search issues
Overview
Debugging is something you’ll become familiar with for Search. From QA’ing a new experience, testing changes to a configuration, or investigating a search quality issue, debugging is a necessary task to ensure the Search experience is working as expected. If done properly, you’ll isolate the issue and either be able to implement the solution yourself, or in cases where the solution is controlled by engineering, be able to clearly articulate the issue to them so that they can implement the fix.
The first step to addressing these issues is to determine whether they’re backend or frontend issues.
If you’re seeing issues with the quality of the search results, you’ll likely want to start your debugging flow in the backend. A general rule of thumb when it comes to classifying backend vs frontend issues is that if the algorithm returns the wrong results, or results in the wrong order, you have a backend issue. If the results are being returned and ranked correctly in the backend, but you see something different in the frontend, then it’s likely a frontend issue. You can determine this pretty easily by running test searches in the frontend and comparing them to the results in Test Search, which show the backend results.
Backend Debugging Tools
This unit will focus on how to leverage these tools to help you debug your Search backend. We’ll focus on what these tools are, how to access them, and what types of information you can get from them, so that you have a good starting point for debugging backend issues.
There are several useful tools at your disposal. Once you’ve built a Search experience for yourself and start debugging, we recommend checking out the reference docs on each tool for full lists of attributes found in each. The tools and relevant reference doc you have available are:
We also recommend checking out the help articles on debugging backend search issues for guidance on how to debug specific issues using these tools. Start with the How to Start Debugging Backend Search Issues help article, which walks through steps that can resolve most issues and links out to help articles on specific categories of issues for more guidance.
Using Test Search to Debug
Test Search is often the best place to start when debugging the backend. If you’re spotting some strange results in the live experience, or even just making changes to your configuration, you should use Test Search.
Placing a Test Search is a great way to isolate the backend Search configuration from the frontend and see what your “raw” search results look like.
The main purpose of Test Search is to see search results and then access the Search Log Details page, which contains most of the tools you’ll want to use in your debugging.
Check out the Test Search unit to learn more.
Using the Search Log Details Page to Debug
The Search Log Details page is where you should be spending most of your time when debugging. Each search run has a Search Log Details page that shows the results returned for that historical search, as well as the factors that caused those results to be returned. This page helps you understand why certain results were returned (or not returned). We’ll walk through the various types of search factors below. They can be broken down into three categories: search factors that affect the search as a whole, those that affect how verticals are ranked against one another, and those that affect which entities are returned.
In general when debugging, you want to compare the expected results to the actual results and determine how and why they differ. Search logs provide details on why the actual results appear.
Check out the Search Log Details Page reference doc for a full list of attributes.
How to Access the Search Log Details Page
Search Log Details pages can be accessed from multiple pages under each Search experience:
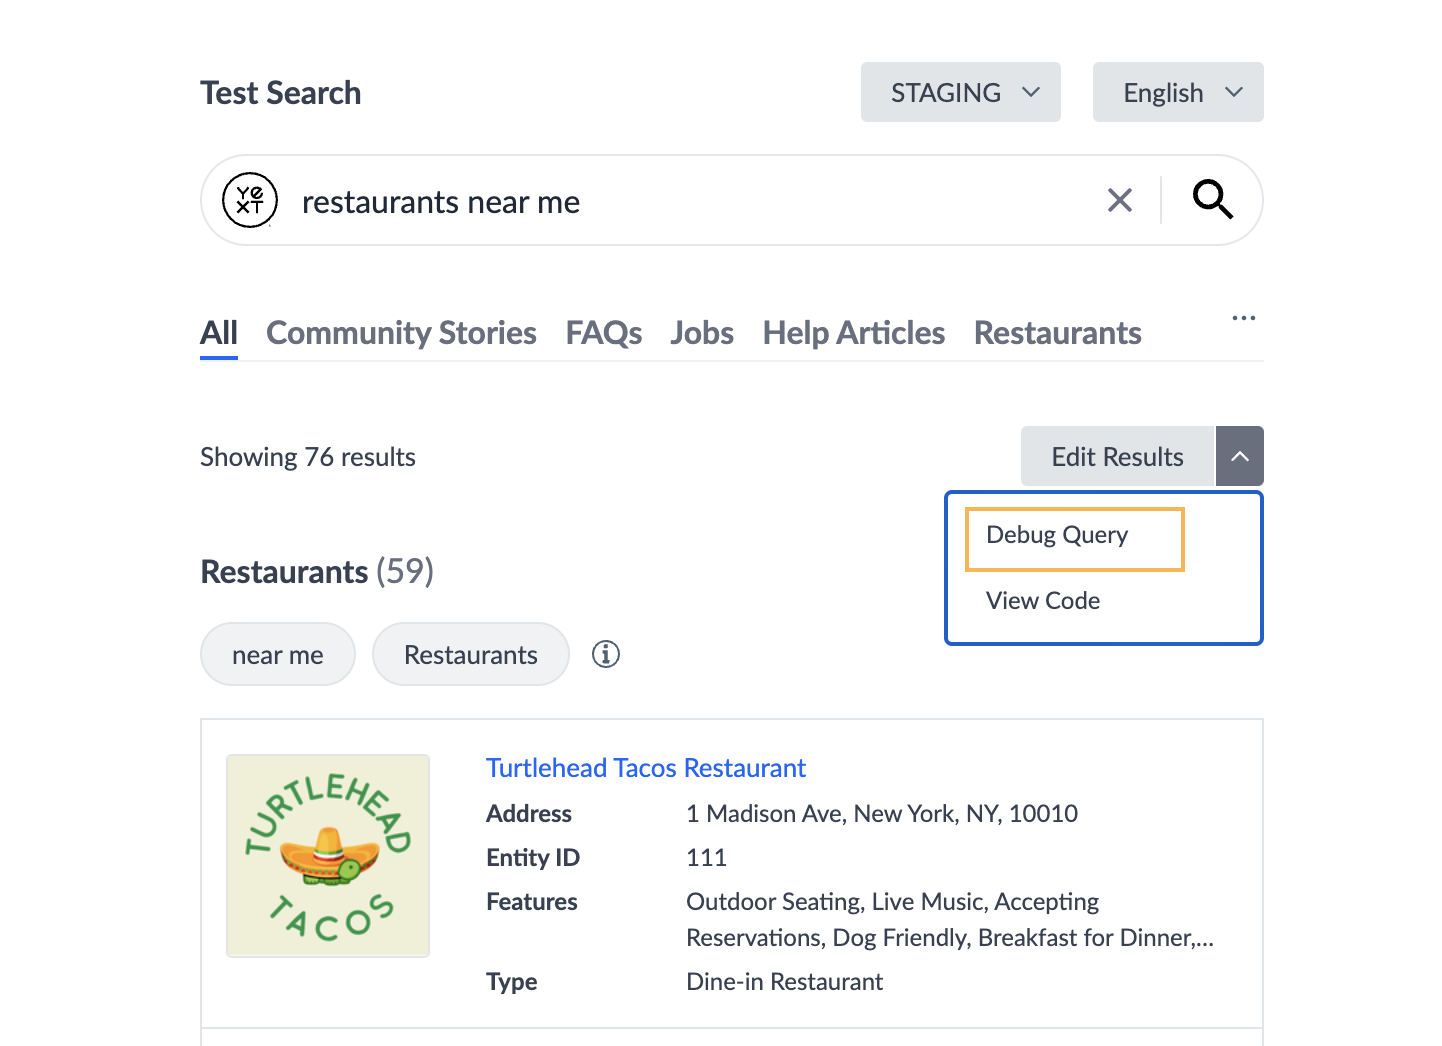
After running a Test Search by clicking the dropdown, then clicking Debug Query.
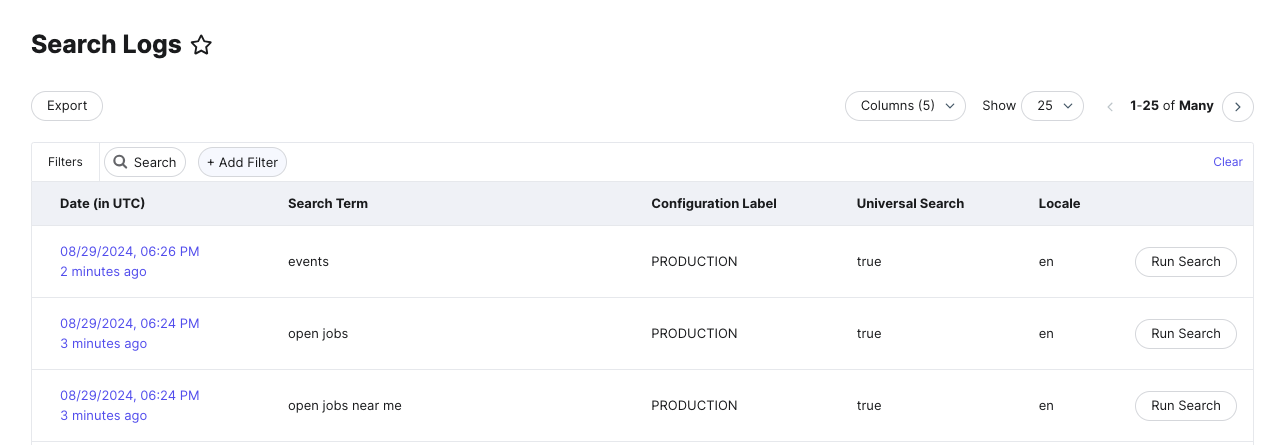
On the Search Logs screen by clicking into the relevant search log for searches. These are sorted by most recent, and you can use the search bar or filters to narrow down the searches shown.
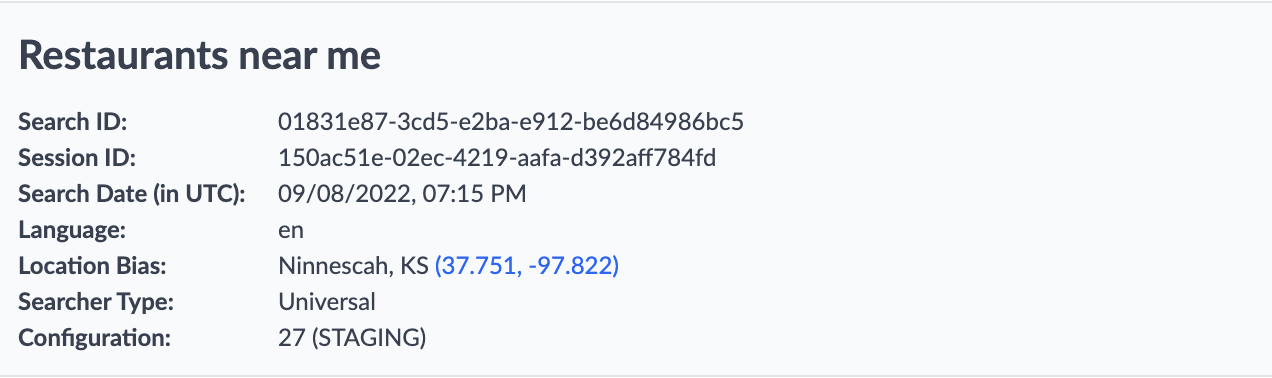
Search Metadata
Search metadata can be found in the box above the results, right under the page title. Search metadata is a combination of inputs from the user’s search like location bias and language as well as outputs from the system such as Search ID and Session ID used to identify a unique search that help provide you with additional context for the given search. From a debugging standpoint, there isn’t much to glean here, but there are a couple of things worth calling out:
- Location Bias: the searcher’s location, which can help debug location searches.
- Configuration: the configuration version number and label - this can help you spot a situation where the configuration label is set to the wrong version - either in a staging experience, live experience, or both.
For more details on the attributes found here, check out the Search Metadata section of the Search Log Details Page reference doc.
Search-Level Search Factors
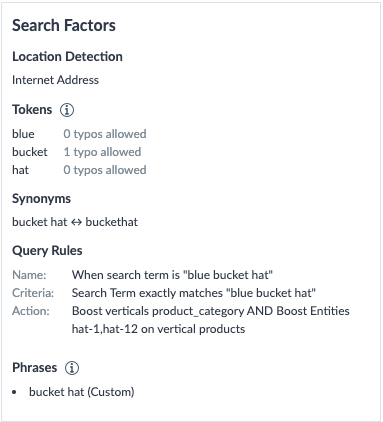
Search Factors tell you all of the factors that were applied during your search to return a particular result set. The search factors found in the box in the upper right of the screen are search-level search factors, which means they are applied to the whole search.
This is where you should start when debugging your search results, as it is particularly useful in debugging general top-level search issues, like whether a query rule, synonym, or phrase was applied and what tokens or location was detected.
If you determine that one of these search factors was triggered when it shouldn’t have been, or not triggered when it should have been, go back and check that the search configuration is set up properly for the results you want.
For more details on the attributes found here, check out the Search-Level Search Factors section of the Search Log Details Page reference doc.
Vertical-Level Search Factors
Vertical score is indicated in the top-right corner of each vertical in the results and indicates the vertical’s relevance to the query. This controls whether the vertical is returned at all and what order it appears relative to other verticals. To learn more about our vertical scoring algorithm, see the Vertical Ranking .
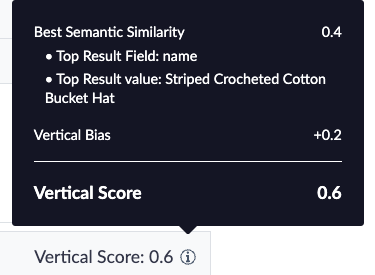
The vertical score is based on the most semantically similar entity (it shows the top result field and value) and any biases or thresholds configured by the user. If you have questions about why certain verticals appear or why they are ranked a certain way, check the vertical scores for that particular search log.
For more details on the attributes found here, check out the Vertical-Level Search Factors section of the Search Log Details Page reference doc.
For steps on debugging common issues, check out the Search Backend Troubleshooting: Vertical Ranking help article.
Entity-Level Search Factors
The results section of the Search Log will tell you why each entity was returned, its similarity to the query, the entity sorting order within the vertical, and more. This is where you’ll spend the most time when debugging why certain entities were or weren’t returned and the order they were returned in.
There’s a wealth of information that can be used from this section to debug, starting with two attributes right below the vertical name that are applied to the vertical as a whole:
- Inferred Filters: Any entity that does not satisfy the triggered inferred filter exactly will be filtered out. This is particularly useful when trying to figure out why a certain set of results is showing, or why a certain set of results is missing.
- Sort Order: Shows the sorting rules applied to the vertical. Use this to determine why results are returned in this particular order.
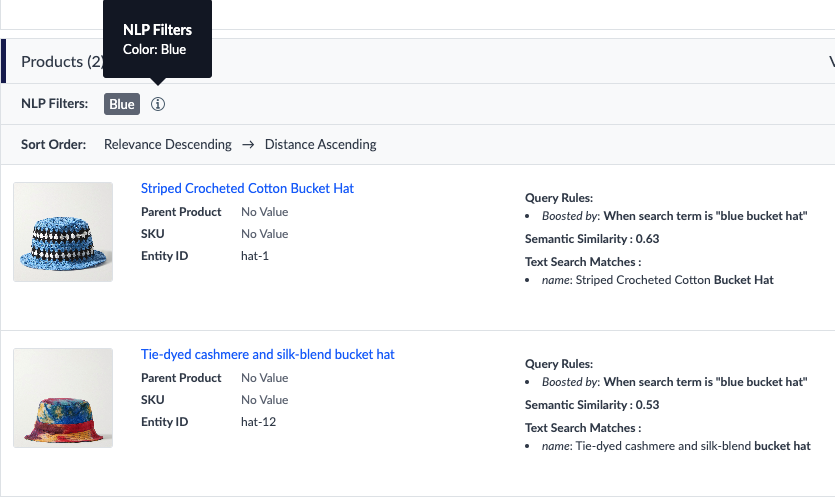
Below this is the top 10 results for each vertical. The right side of each result card shows the factors that caused the entity to be returned:
- The field name and value of any non-inferred filter searchable fields matches, including keyword search, phrase match, and document search. In the above example, you can see two keyword search matches on the
namefield, with the match tokens bolded. - Any Query Rules that were applied to an entity, causing it to be returned or changing the order it appears.
- The entity’s semantic similarity to the query if semantic search is enabled. The semantic similarity of the top result impacts the vertical score.
For more details on the attributes found here, check out the Entity-Level Search Factors section of the Search Log Details Page reference doc.
For steps on debugging common issues, check out the Search Backend Troubleshooting: Incorrect Entity Results help article.
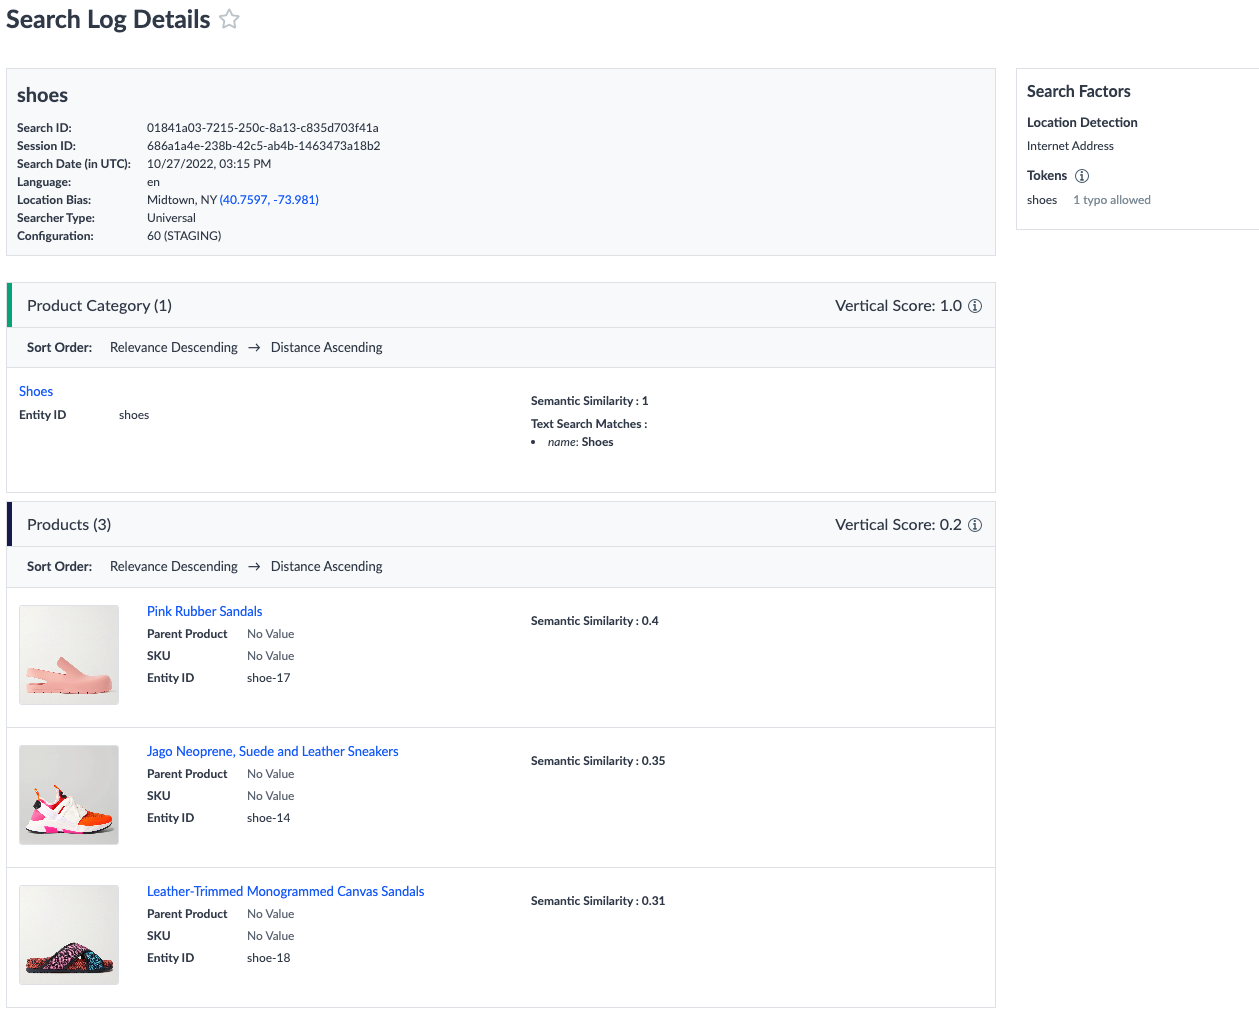
Debugging Example
Consider the following search log for a query that returned both vertical and entity results in an unexpected order:
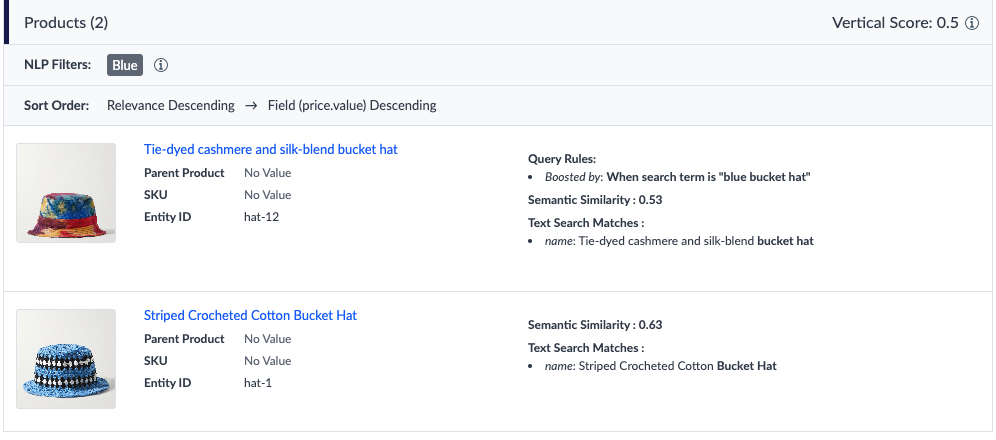
We see that the result with a lower semantic similarity is appearing first - that’s weird! However, there is a Query Rule that boosts that particular entity, which explains why it got returned first. This has implications on the vertical score - remember, the vertical score calculation starts with the semantic similarity of the vertical’s top result - which in turn, can impact vertical ranking. Inspecting the search log showed why this vertical returned lower and why the entities returned in a different order than expected.
Using the API Request to Debug
Our Search APIs are built off the Live API and the request contains much of the same information that you’d find in the Search Log screen, but in the form of a JSON blob. For those who are more used to working with JSON objects, using this to debug may be more intuitive. To read up more on how our Search APIs work, check out the Search API documentation .
The API request is useful for targeting any discrepancies between the backend data and the frontend display. The frontend inherits the information to display from the API response, so if the information isn’t there, the frontend can’t display it! For example, if you are using a subtitle of c_providerTitle on your doctor card and it isn’t displaying right away, look at the API request. If you can’t find that value in the API request, there’s your problem! If you are seeing that data is not appearing right away in the API results, then there could potentially be a lag.
How to Access API Requests
There are two (2) ways to view Search API requests:
- In-platform
- Using the console
Viewing In-Platform
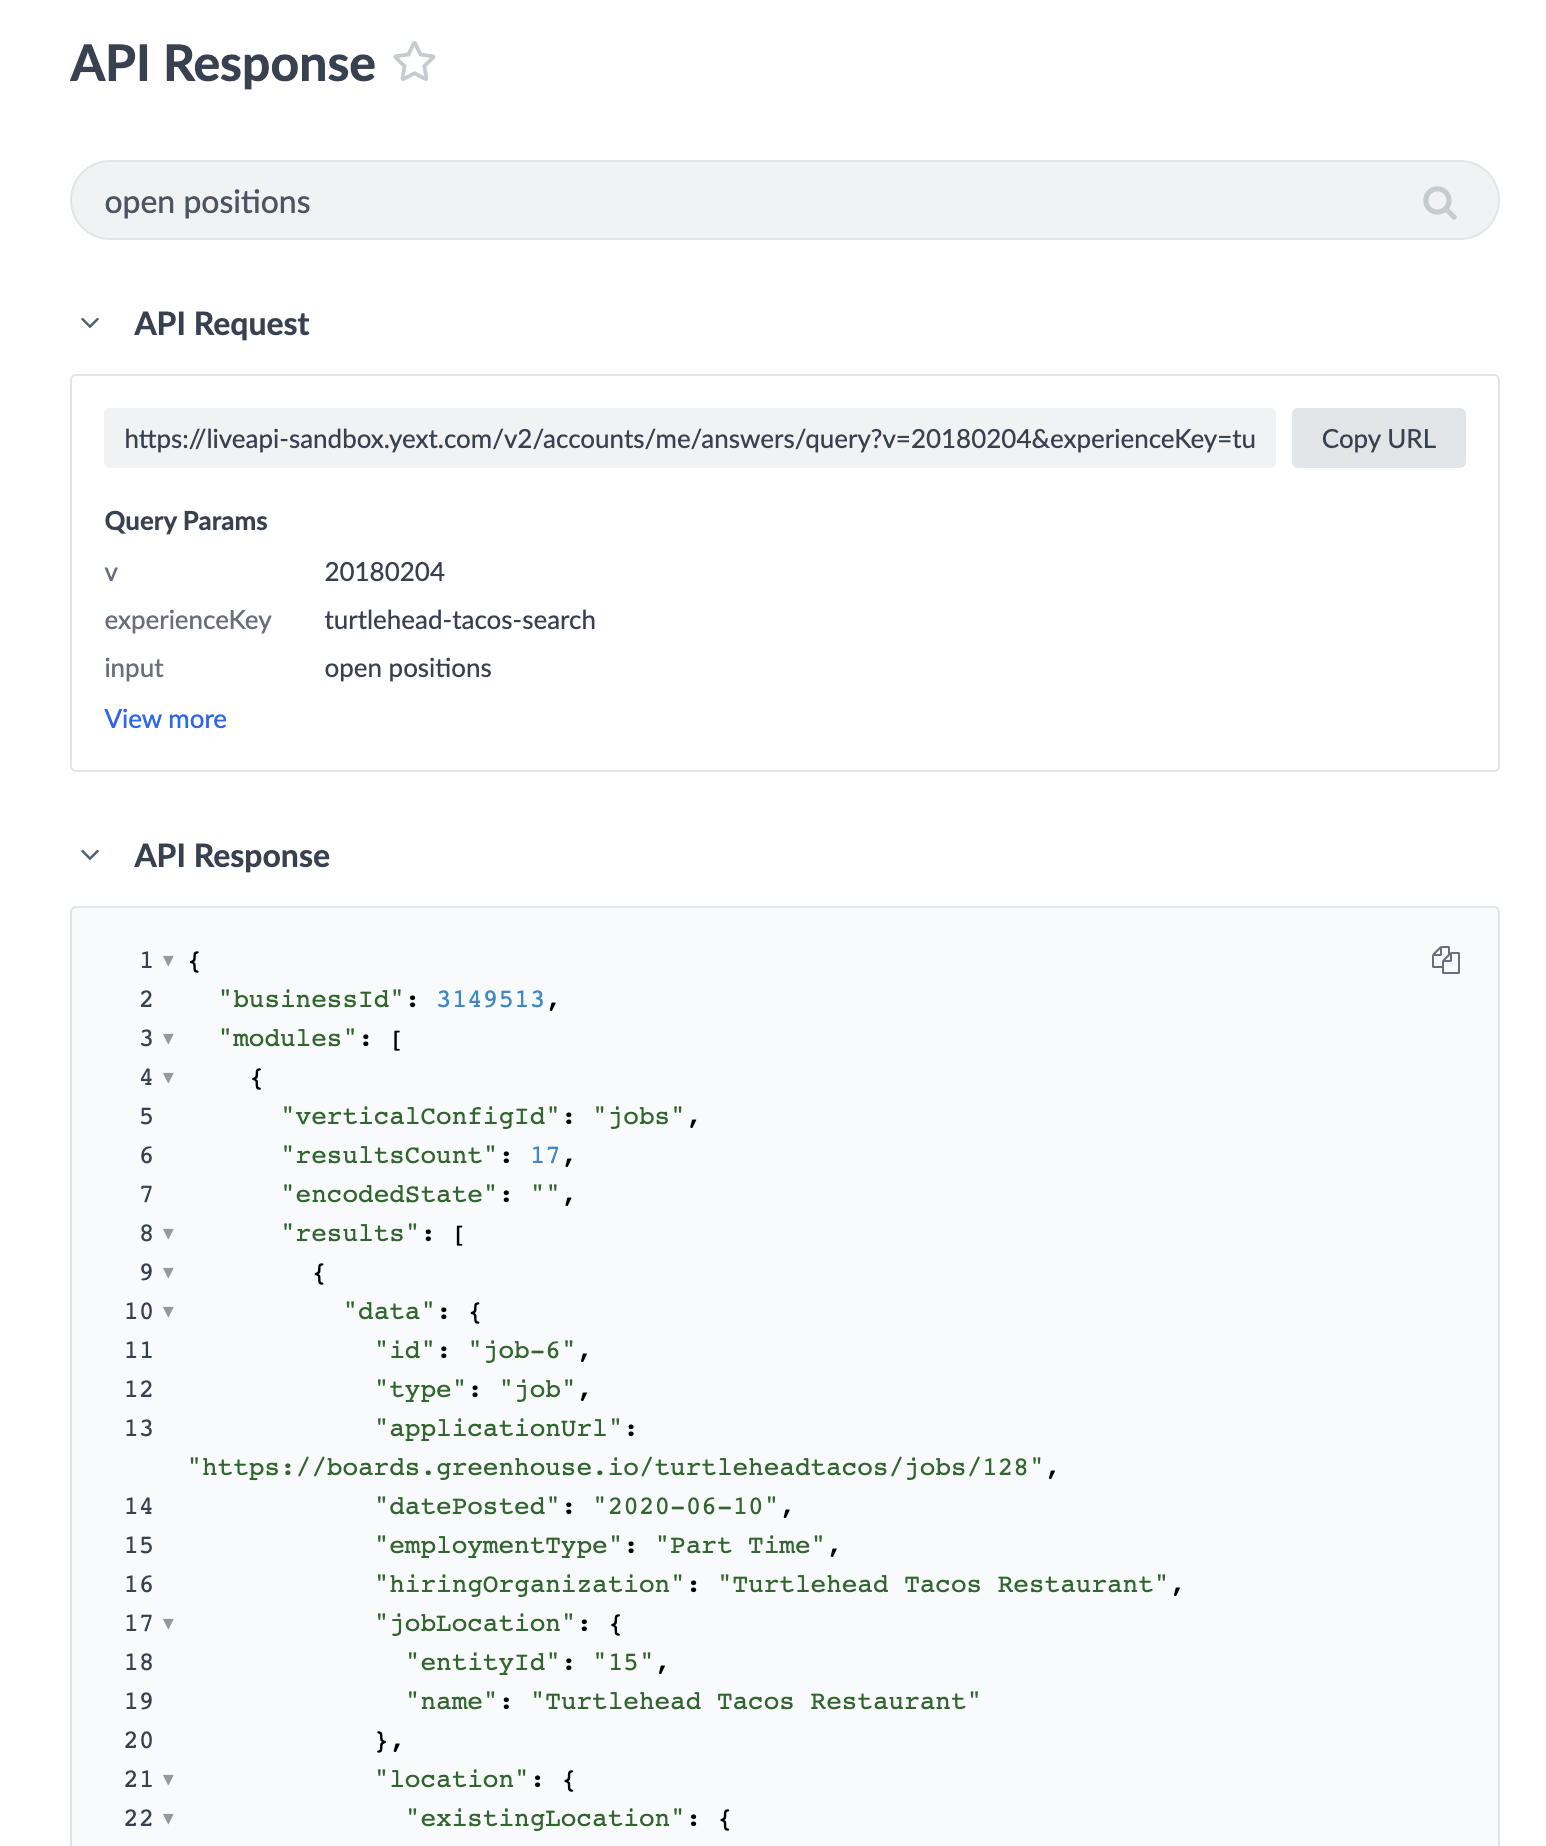
You can view API logs directly from your Test Search results. Click the code brackets icon, labeled “View Code”, in the top right of your Test Search results.
In the next window, you can view and copy the raw API response (with line formatting options), as well as copy the URL of the API request to share with others or open in your browser.
Viewing in the Console
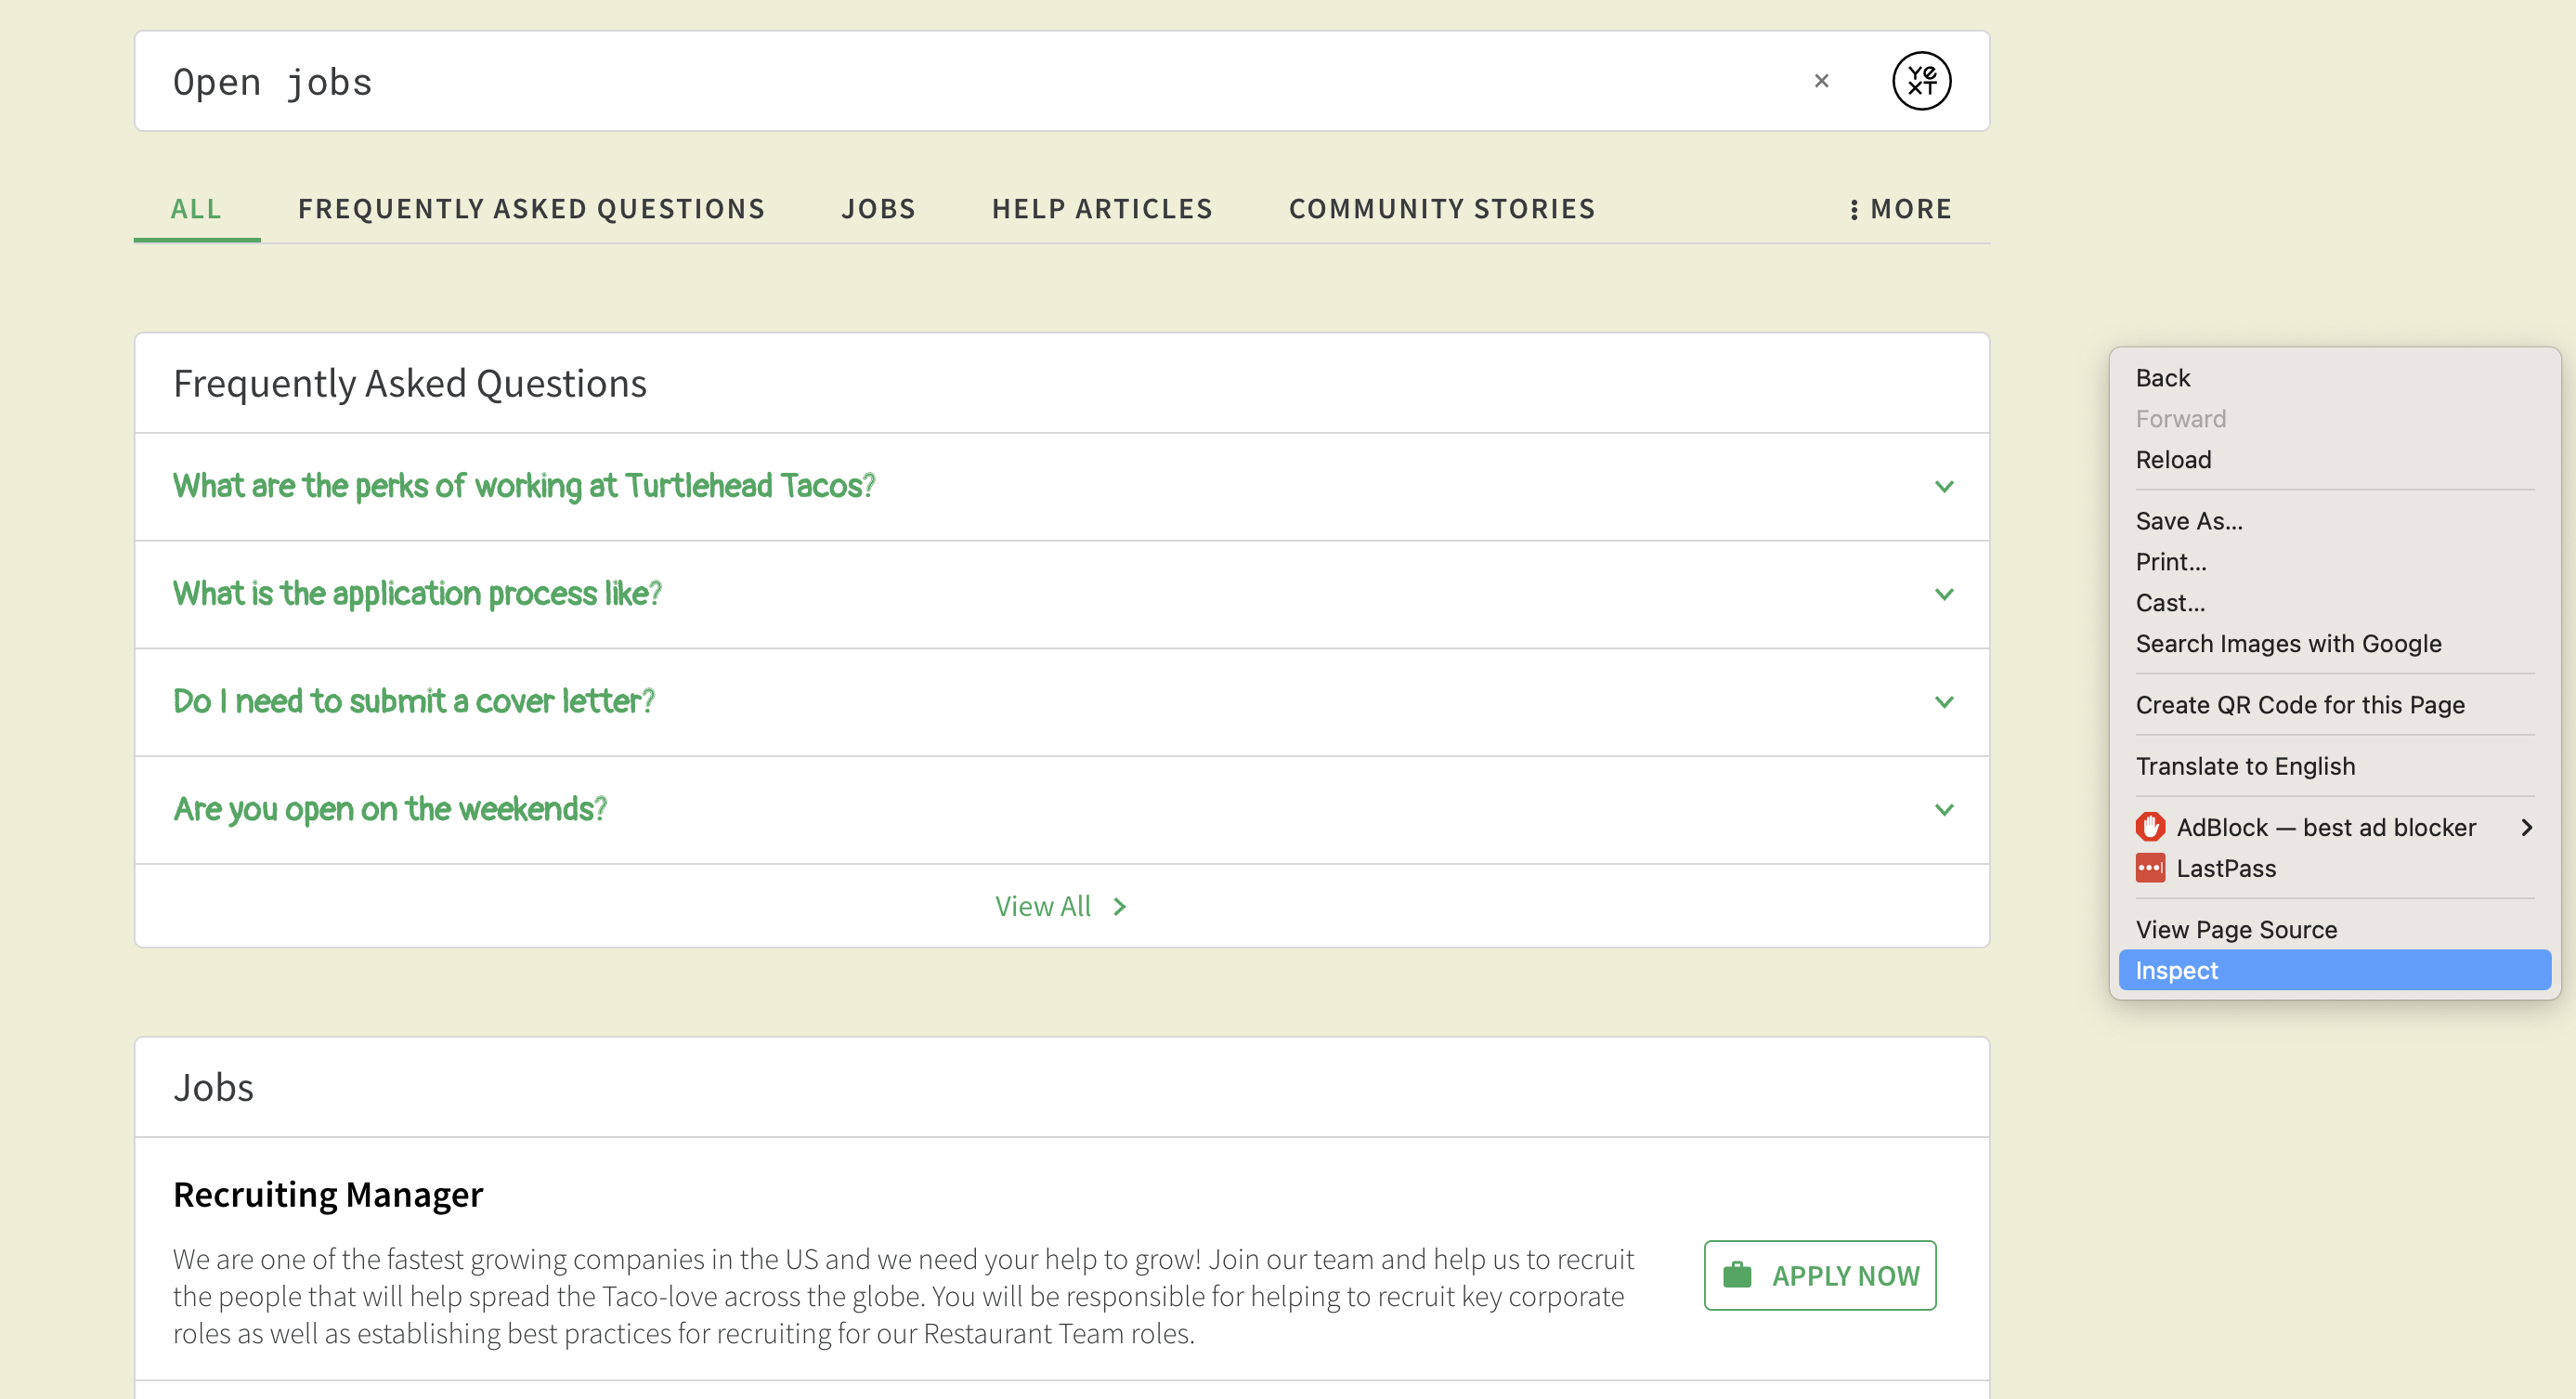
Alternatively, you can right click on the results page and click “Inspect” to access the console.
command + shift + c. For Windows, use ctrl + shift + c.
Once you click “Inspect”, navigate over to the “Network” tab. Rerun the search and you will see a Live API request show up, which you can always identify via the “query?” naming convention.
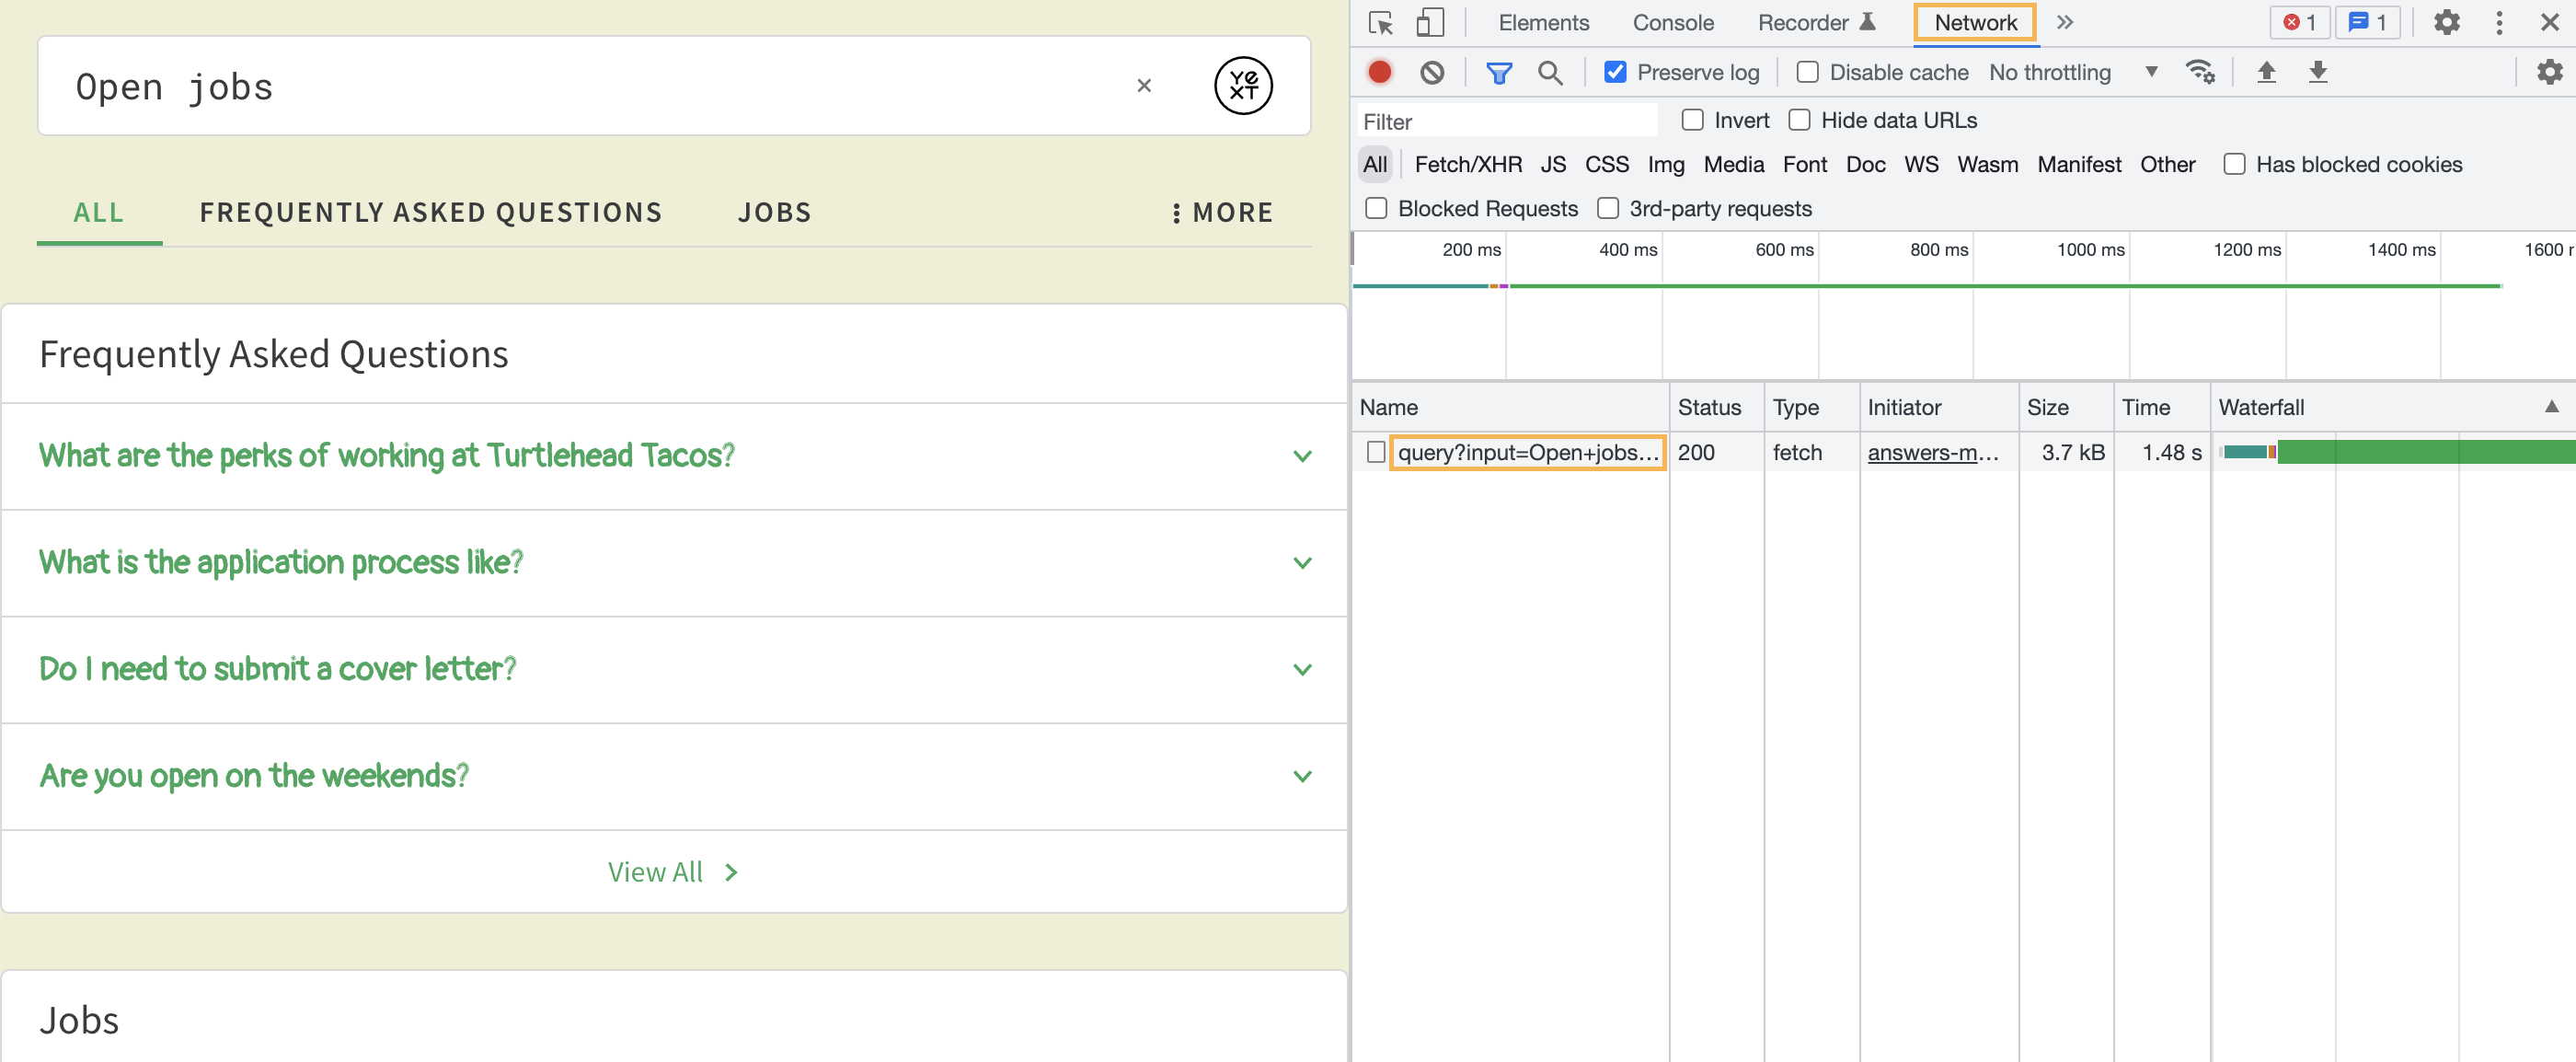
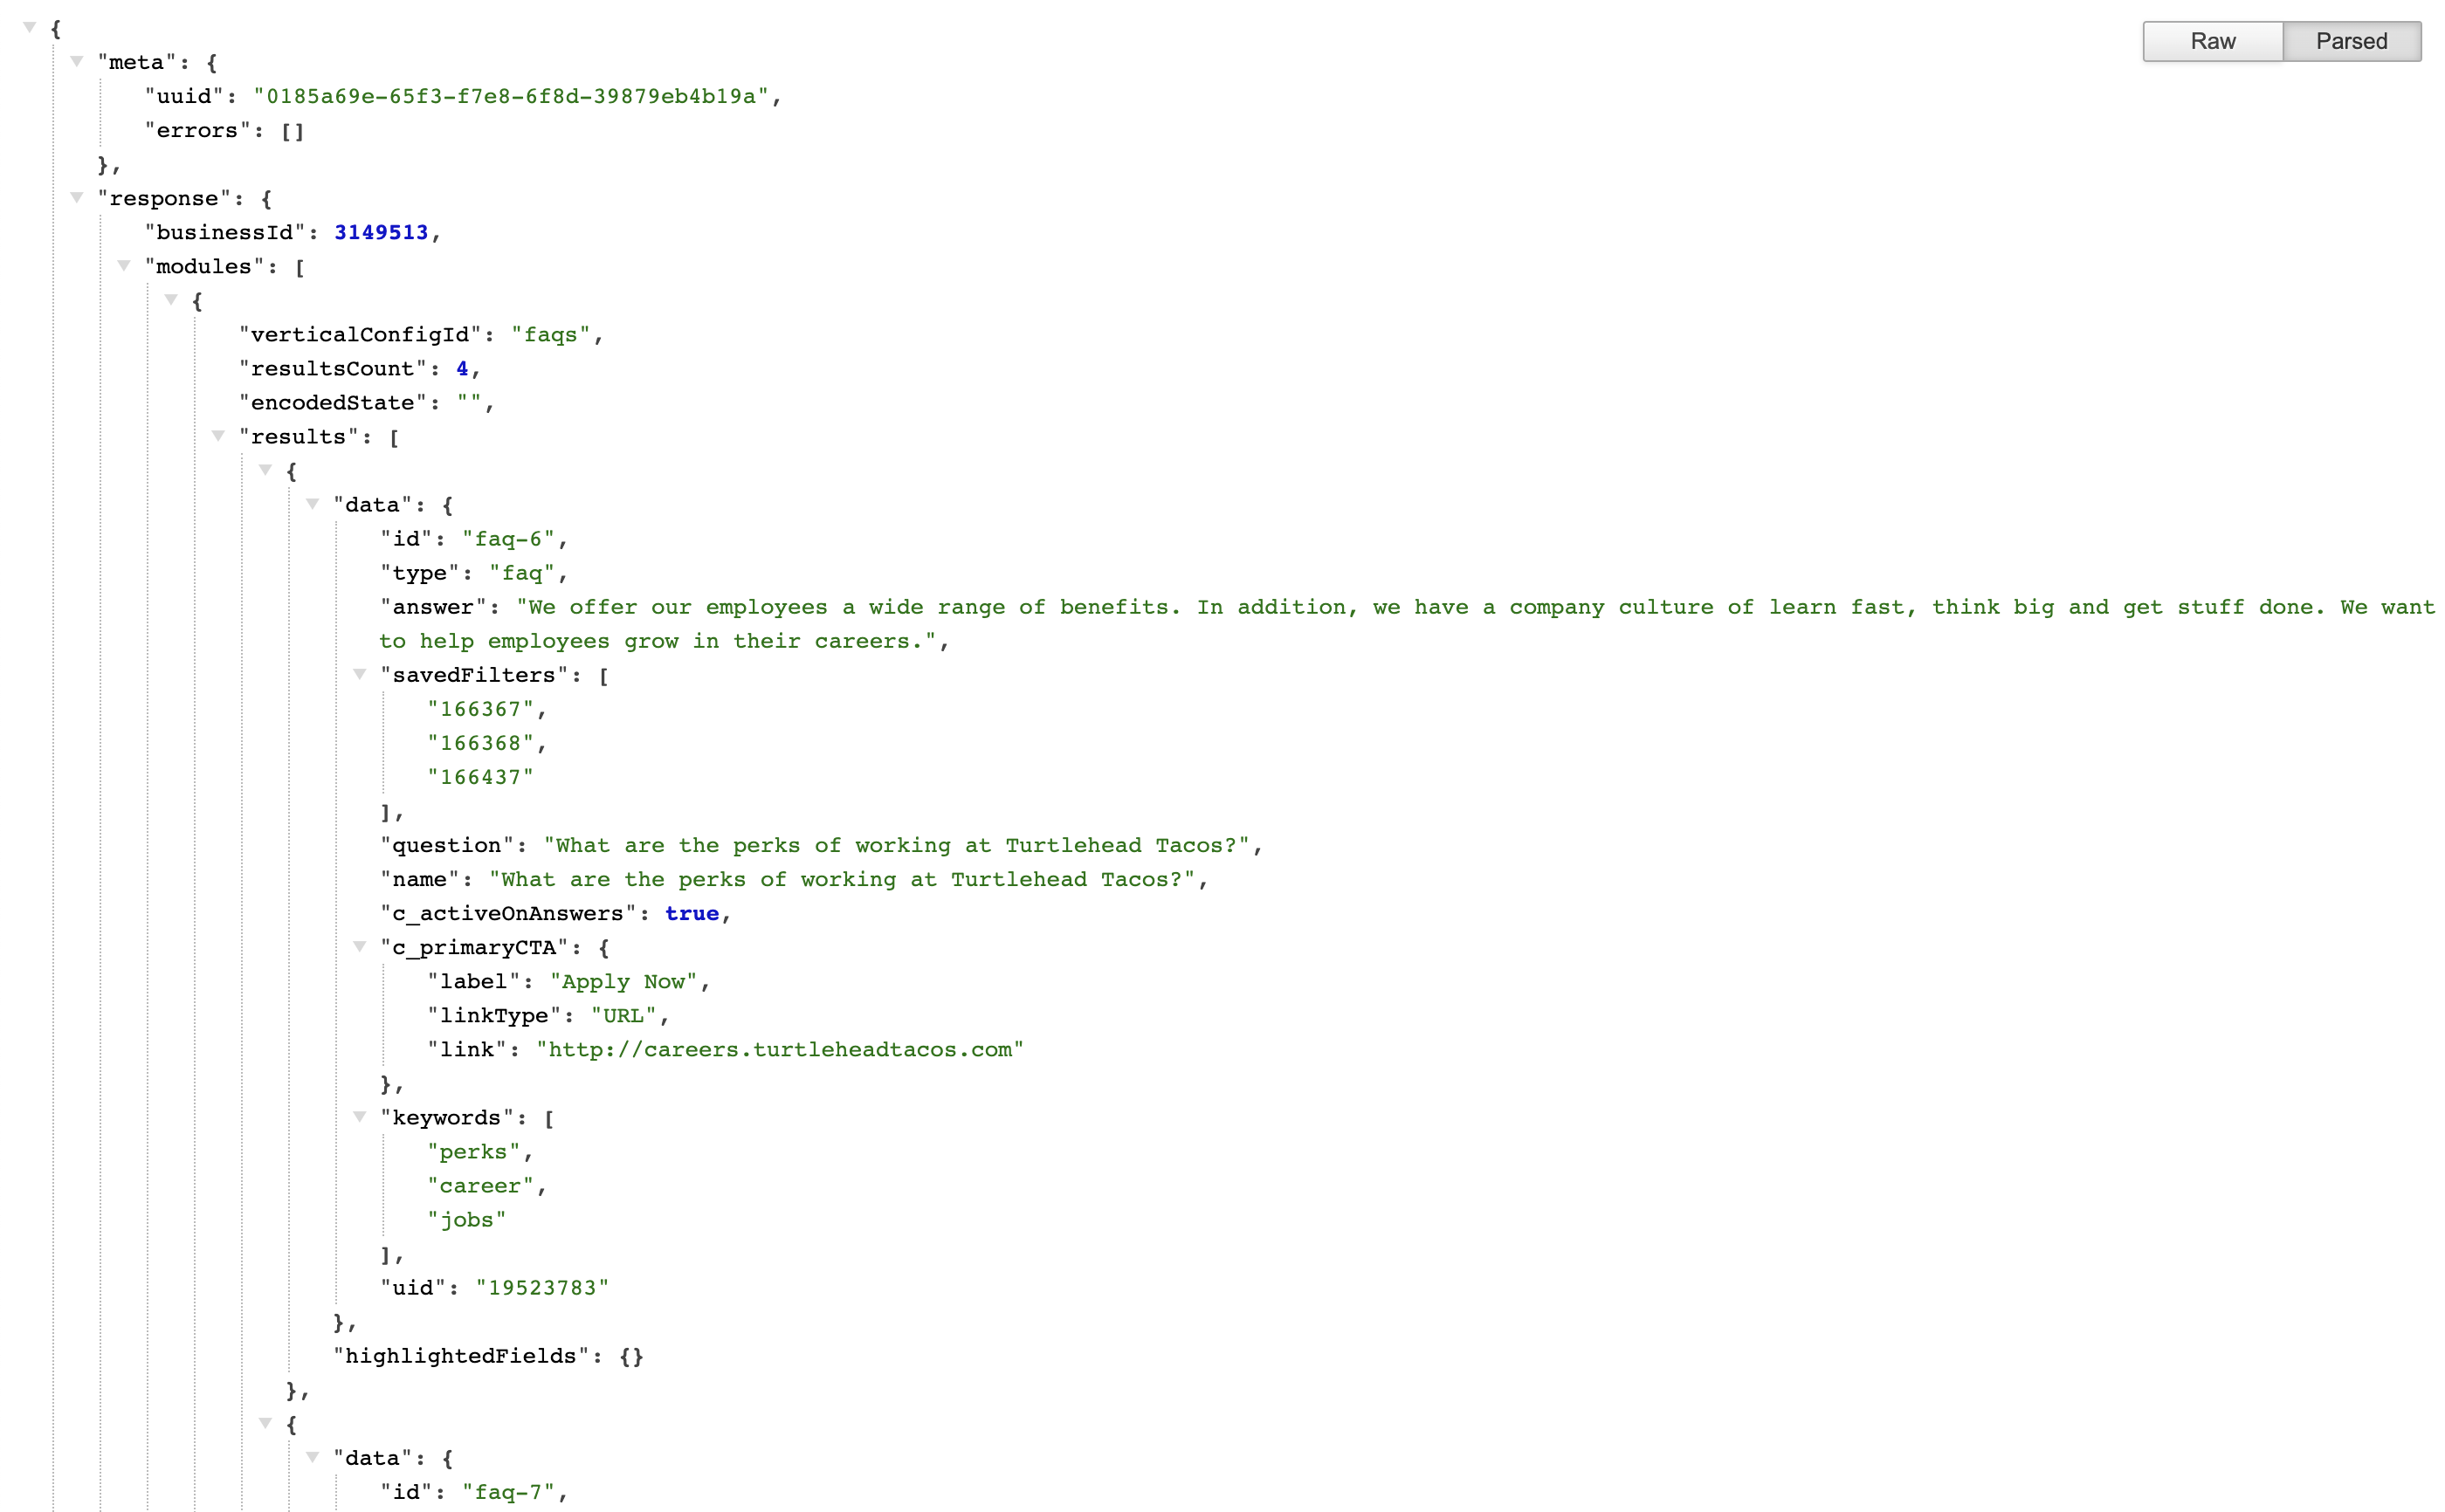
When you run the search and double-click on the API request, a new tab will open and you’ll be presented with a JSON blob containing all of the vertical results. The result will look something like this:
What to Look for in an API Request
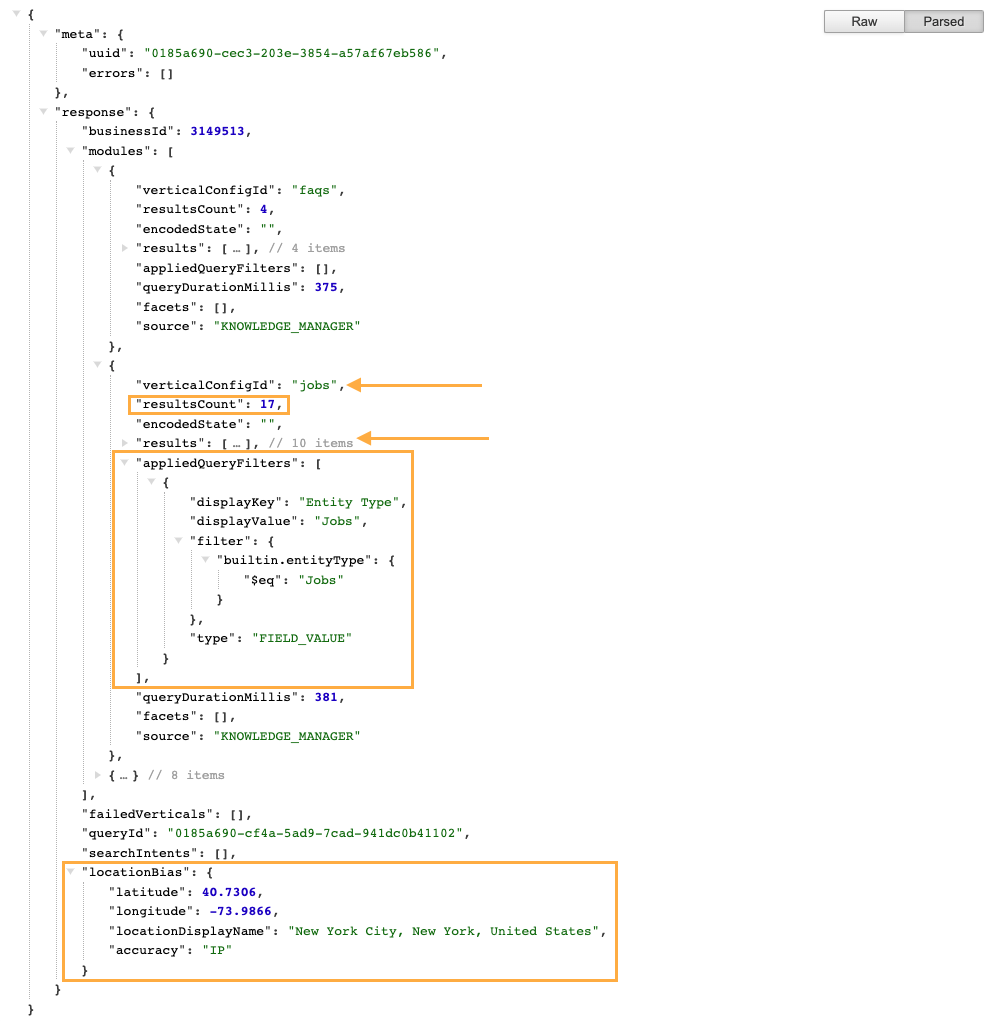
At a high level, you should always see something returned in the API request. Even if the search returned no results, you’ll be able to see that there were no results returned and the location bias of the searcher.
When reviewing API requests, you’ll see a lot of data returned. You may want to collapse long sections (such as results objects) or use CTRL+F to find what you need. From a debugging standpoint, there are a few helpful sections:
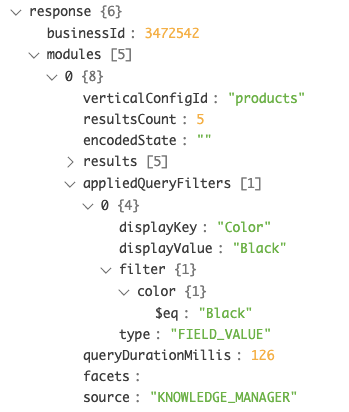
- In an API request for a universal search, each vertical is a separate object in the
modulesarray (verticalResultsarray in the platform) and labeled with the vertical (verticalConfigIdin the console,verticalKeyin the platform). This is helpful to see which vertical(s) were returned for this search. resultsCountshows the number of results returned for that vertical, which is helpful for a quick check.appliedQueryFiltersshows any inferred filters that were applied, including the field (displayKey) and value (displayValue), which may help explain why certain entities are or are not in the result set.locationBiasshows the location of the searcher and the reference point for any place searches.resultsreturns the first page of results (if you have a universal limit of 3, the console API request for the universal search will only show three results even if the vertical returned more) and all the content passed in for each result. If content on the frontend is not showing up or showing up differently than expected, you’ll first want to see what information is being passed from the backend to the frontend.
- Within
results,highlightedFieldsshows all matches for keyword search and phrase match, including the field name (object key),valueof the field, and offset position and length of thematchedSubstringsso you know exactly what part was pulled in as a match.
Oftentimes, you can get a quick summary of how the results were returned by looking at factors such as any inferred filters that were applied, or the location of the searcher. To do this when viewing the response in the web, or an external application like Postman, you can click the carat to the left of the results object to collapse it like so:
Check out the Search Query API Responses reference doc for a full list of properties found in the response.
Experience Training
Experience Training is a way of overriding a prediction served by the Search algorithm in the platform. Use it as a debugging tool to optimize results by accepting, rejecting, or editing results.
There are two primary debugging use cases for experience training:
- Overriding a bad prediction from the system. For instance, if the algorithm serves a prediction for an inferred filter that you don’t want, you can reject it in Experience Training and no filter will be applied.
- Auditing a previous override that may be causing the issue you’re trying to debug. If you’re seeing an issue with an inferred Filter, Featured Snippet, or spelling suggestion, there might have been an Experience Training override approved for that search term. This is an especially common issue with inferred filters and featured snippets, since we can serve multiple predictions per search term, so in theory, multiple approved overrides for the same search term can be active at once (Product is working on a way to address this), which will confuse the algorithm and impact the desired results, so this is an important tool to use in your debugging flow.
Read more in the Experience Training unit .
For more details on the attributes found here, check out the Experience Training Table reference doc.
For steps on debugging common issues, check out the Search Backend Troubleshooting: Experience Training Overrides help article.
Summary
Now that you’re familiar with the different debugging tools at your disposal, you should now feel empowered to tackle backend search quality issues! Once you are start debugging, we recommend you view the accompanying reference documents and help articles, linked at the top of the page, to guide you in addressing specific issues.
True or False: The Search Log Details page provides you with a historical, backend view of not only what results were returned but also why results were returned
What are some examples of search factors found in the Search Log Details page?
True or False: When inspecting the page and looking at API results, it is not possible to see what inferred filters were applied.
True or False: When looking at API results, you should always inspect the Universal results, not Vertical results.
If you don't like a featured snippet that is returned or an inferred filter that is applied for a given query, can you do anything about that?
Way to go, you passed! 🏁
