
Intent Insights | Yext Hitchhikers Platform
What You’ll Learn
By the end of this unit, you will be able to:
- Explain what clusters are and where to find their performance data
- Determine how a cluster is performing based on the provided metrics
- Work through a suggested actions flow for a cluster
Overview
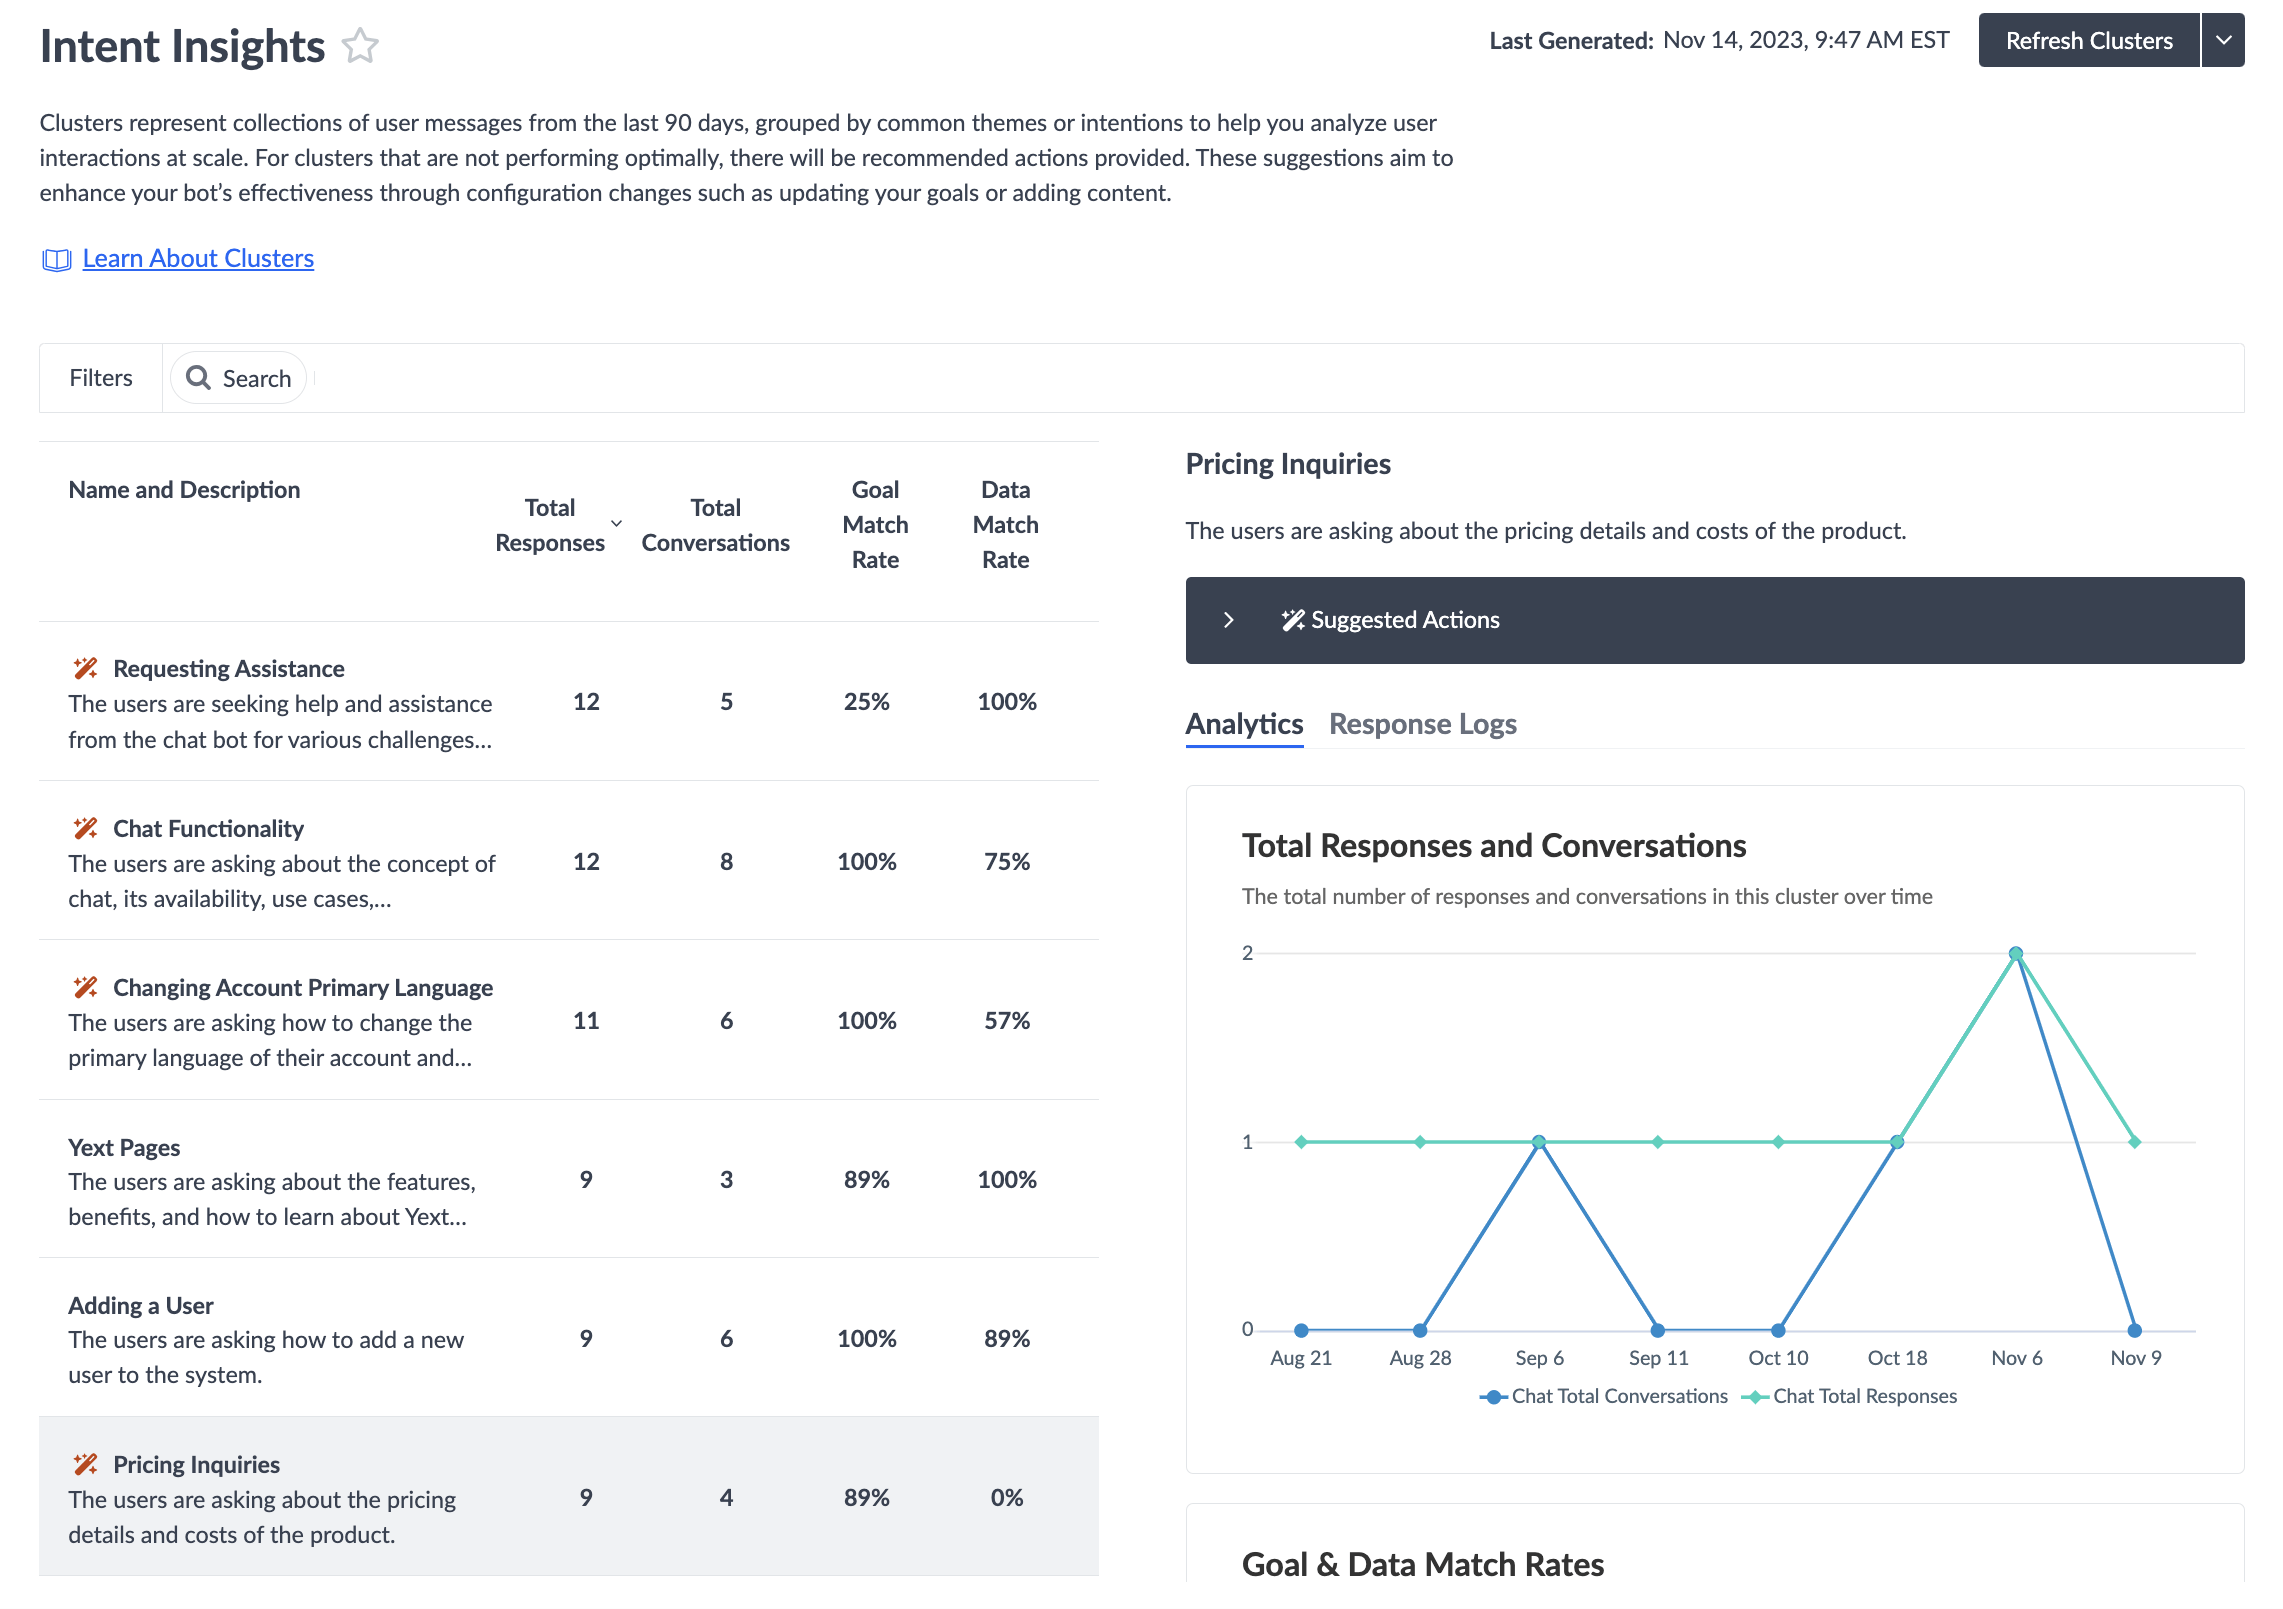
The Intent Insights screen, within the Analytics and Logging section of your bot, helps you identify topics that users are more commonly looking for. Yext Chat groups similar queries together so you can see trends of what users are searching for. With this screen, you can see how well Chat is performing for certain clusters which will help you further optimize your bot.
For example, if users are sending messages like “open jobs,” “career opportunities,” and “are you hiring?”, Chat will group these together into a cluster like “Job opportunities”.
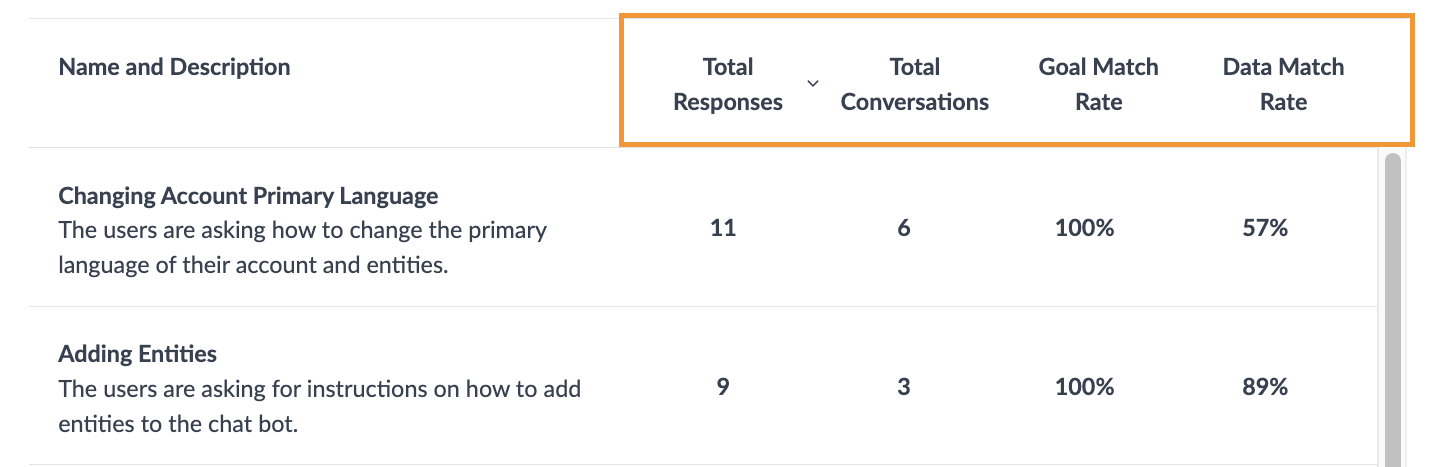
On this screen, there is a table with all clusters identified by Chat on the left-hand side of the screen. In this table you can see the following:
Name and Description: These help you understand what the high-level topic of the cluster is. If users are looking up location or store information you may see a cluster with the name “Locations in New York” with a description like “The users are asking about the different locations and communities in New York, including pet-friendly options and proximity to other states.” In order to generate cluster names and descriptions, we take a subset of your bot’s message logs and feed them into OpenAI.
Total Responses: The number of user messages that make up the cluster. For example, a user message that is in the “Locations in New York” cluster might be “Where is the nearest location to NYC?”
Total Conversations: The number of bot conversations that include this topic or related queries. There may be cases where a user sends multiple responses that relate to a cluster within a single conversation.
Goal Match: Percentage of responses in the cluster that had a goal associated with it. A higher percentage means that a goal or goals are being triggered when users inquire about that cluster topic. Data Match Rate: Percentage of responses in the cluster that had data within the Knowledge Graph to help answer a user’s message.
You can use the filter bar above the table to search for a keyword or phrase. If the search matches any of the cluster names or descriptions then those clusters will be shown in the table. All other results will be excluded.
You can also change the sorting of the table by clicking one of the metric headers at the top of the table to sort in ascending or descending order. For example, if you click on “Total Conversations” it will order the clusters in descending order with the highest amount of conversations appearing at the top of the table.
On the right side of the screen, you will see more details about a cluster once you click on a cluster in the table. There are three things you can review for a specific cluster including analytics, response logs, and suggested actions.
It is important to note that cluster data on this screen is limited to the following:
Responses are from bot conversations that have taken place in the last 90 days.
Any responses that are made by internal users are excluded (e.g., any responses sent within Chat Preview).
Only the first response within a goal is included. For example, if a user says “I want a demo” and the bot collects user information or preferences within follow-up messages then only the first “I want a demo” response will be included in a cluster.
All responses without a goal match will be included.
Analytics Tab
In the Analytics tab you can see the details for a cluster. The information you see is the similar to the table. You will see data for a cluster including total responses, total conversations, goal match rate, and data match rate. However, the information will be displayed as two line graphs:
- Total Responses and Conversations: The total number of responses and conversations in a cluster over time
- Goal & Data Match Rate: The match rates for both goals and data in a cluster over time.
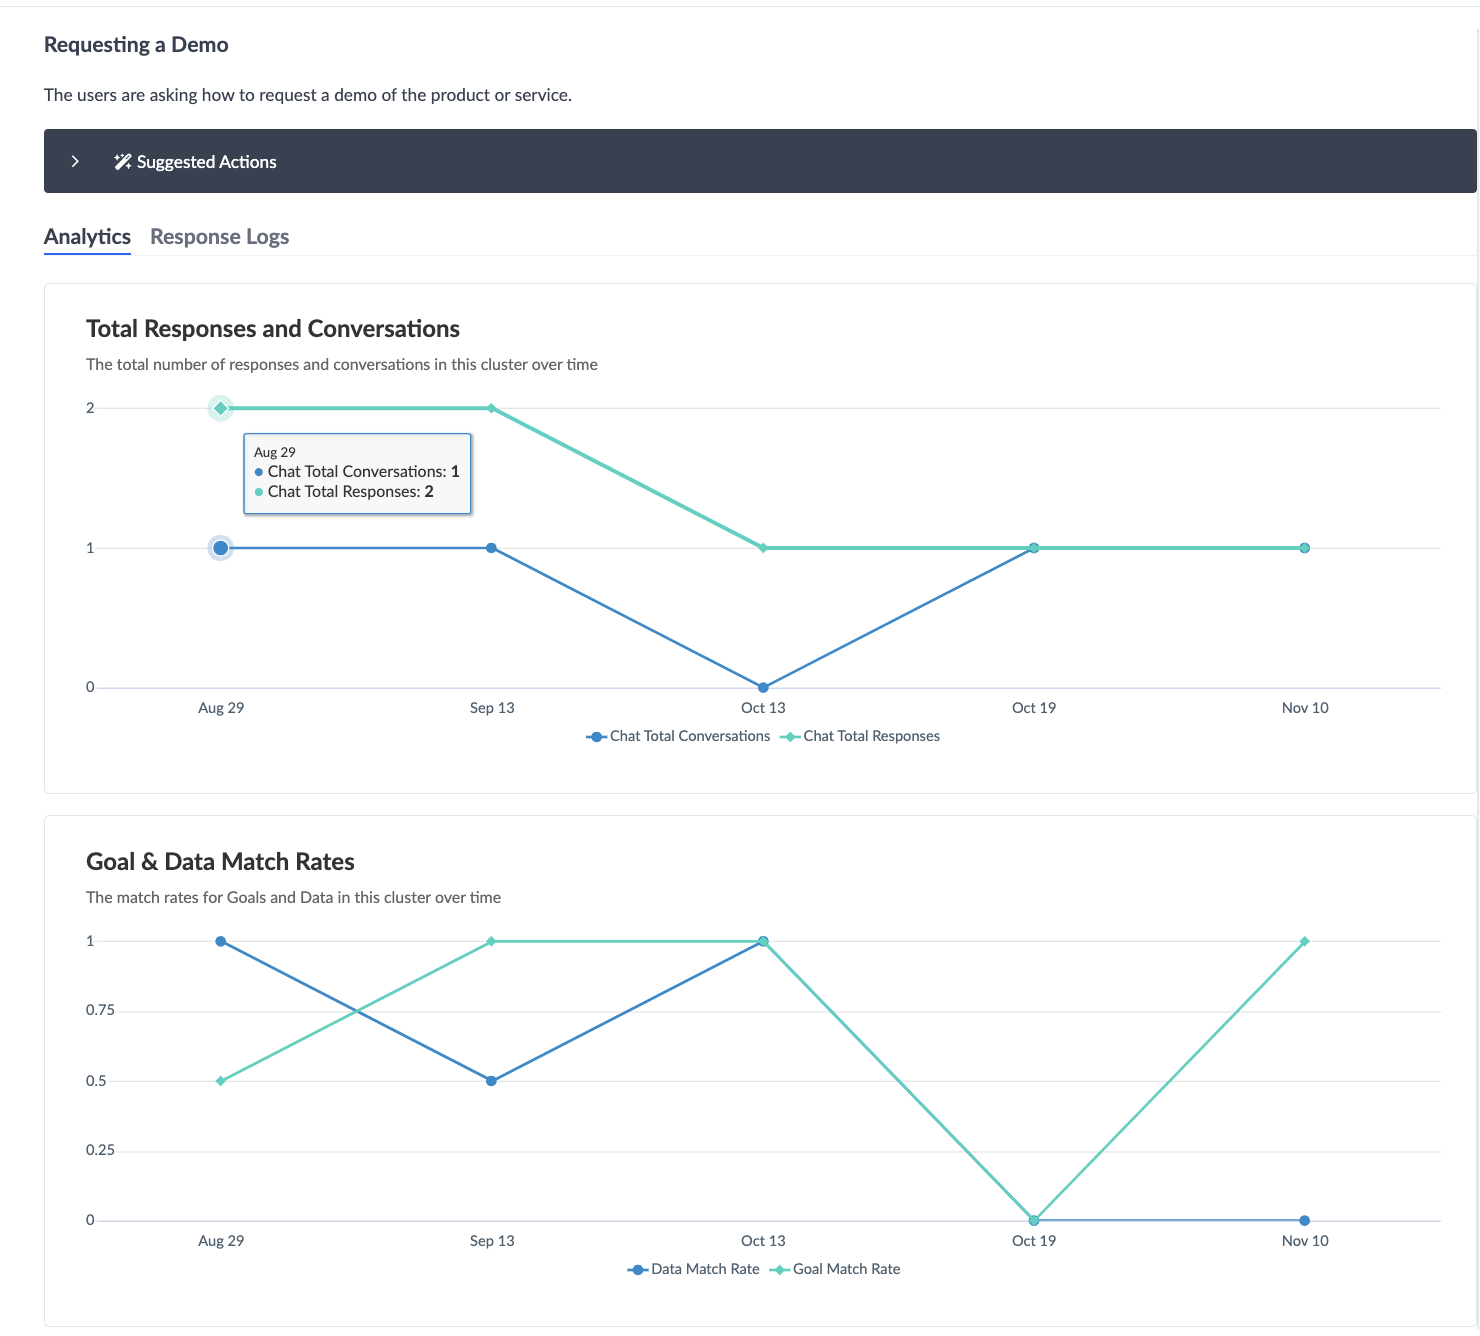
Another key difference here is that you can see the full description of the cluster, which may have been cut off in the table.
Response Logs Tab
When clicking into the Response Logs tab, you can see all the responses that Chat has assigned to a cluster. The table includes a timestamp for when the user submitted the response and the user message.
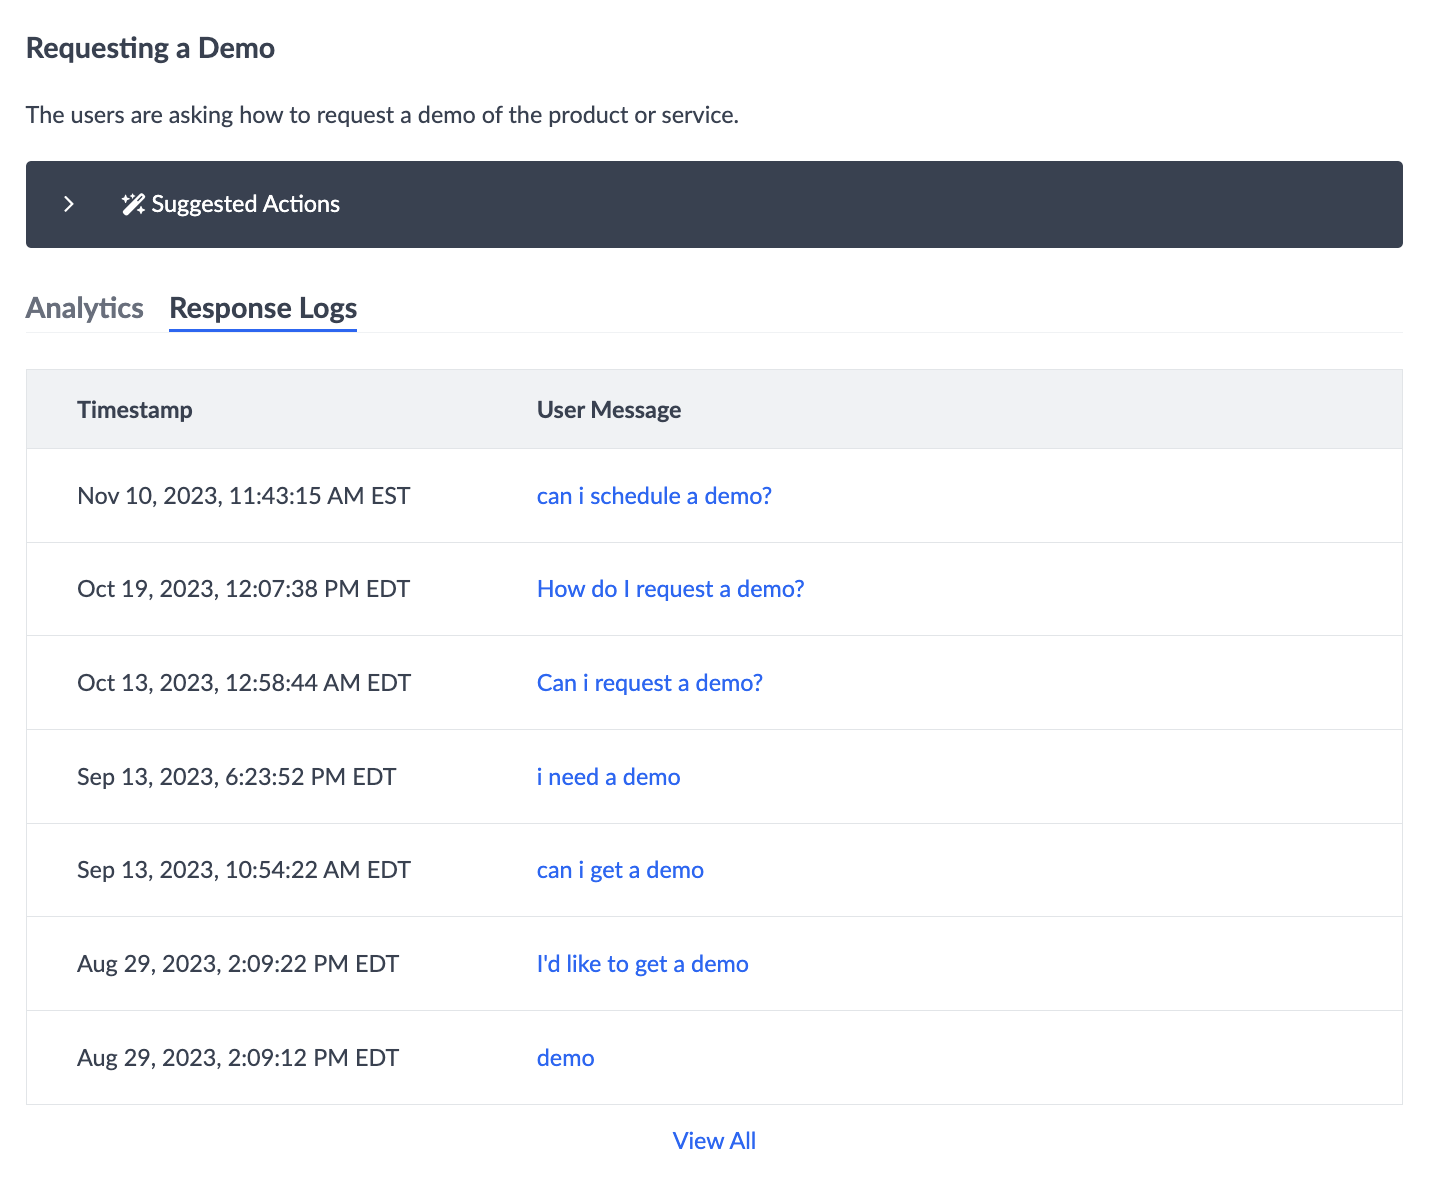
When you click on a user message in the table, you will be directed to the Response Log Details screen for that message.
The table is limited to 10 responses, but you can see more by clicking View All at the bottom of the table. This will direct you to the Response Logs which is filtered to the relevant cluster ID.
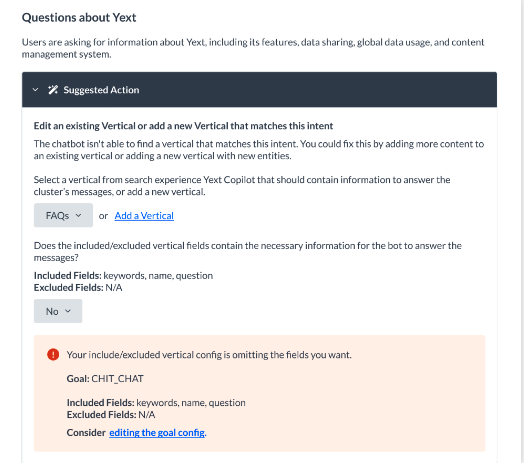
Suggested Actions
This screen also provides Suggested Actions to help with troubleshooting and optimizing Chat. Suggestions appear when the goal match rate or data match rate is low. The type of suggestion that is returned is based on a calculation of these two rates.
The wand icon to the left of the cluster name in the table indicates that there is a suggested action available for that cluster. When you select a cluster with that icon, you will see a Suggest Actions collapsible banner on the right side of the screen with the other cluster details. You will need to click the banner to see the details of a suggested action.
For example, there may be a case where a user is inquiring about your business with questions like “What is your company known for” or “How many employees do you have?” but Chat can’t find the answer. If you already have that information stored in the Knowledge Graph but it is not appearing, the suggested action may be to add a vertical, such as the FAQ vertical, to an already existing search instruction.
Refresh Clusters
You can see when clusters were last updated in the top right corner of the screen where it says “Last Generated”. If you want the data to include new or updated clusters beyond that timestamp, click the Refresh Clusters button next to the timestamp. Note that, clusters are not autogenerated so you will need to refresh clusters to pull in an updated set of cluster data.
Change Cluster Parameters
You can update the requirements of a cluster by updating the cluster parameters. When clicking the dropdown next to the Refresh Clusters button, you can select the Change Cluster Parameters option. This will open a modal with the default cluster parameters filled in. You can update things like minimum cluster size (i.e., the count of similar user queries that need to be submitted to be considered a cluster) or response start and end date which will ultimately impact cluster count. You can also opt to include internal responses.
Don’t worry if you make a change that results in clusters that aren’t preferred or expected. You can always go back to the modal and select Reset to Defaults to restore clusters to their original parameters.
Which queries would likely be included in a "Returns and Exchanges" cluster?
Which of the following are true of cluster data:
True or False: Clusters are generated automatically.
If your bot can't respond to a cluster AND that information is not stored in the Knowledge Graph, what would you expect the suggested action to be?
High five! ✋
