
Chat Analytics | Yext Hitchhikers Platform
What You’ll Learn
By the end of this unit, you will be able to:
- Build a basic Chat analytics report in report builder
- List 3 metrics available for Chat
- Navigate to where you can find more information about Chat metrics
Overview
In the previous units, we took a deep dive into response logs to see what user queries are being submitted to your bot, how often your bot is responding, and the reasoning behind your bots answers. In this unit, we’ll take a step back to look at Chat analytics more broadly.
You can use Chat analytics metrics to measure the success of your bot based on how accurately your bot is responding and how users are interacting with your bot in terms of both frequency and engagement.
Chat Analytics in Report Builder
In Report Builder you can build your own reports using built-in Chat metrics, dimensions, and filters. You can shape the reports to fit your needs and how you want to measure what a successful chat bot means for you. Check out the Report Builder module to learn more.
To use Report Builder, navigate to Analytics > Report Builder. From this screen, you can select various Chat Analytics metrics under the “Metrics” drop-down. Check out the Chat Metrics reference doc for a full list of available metrics.
Once you’ve selected the metric(s) you’d like to include in your report, you can select the type of chart you want to see and update the remaining variables, such as time range, dimensions, and any filters or sorting to be applied.
For example, we could build a report to show the average number of steps a bot completed for a particular chat cluster. Below we have created a table that shows Chat clusters and the amount of steps or instructions a bot completed when a user query was submitted. You can also add the dimension Chat Goal to see if there are any variations in the steps completed for a specific goal associated to a cluster. From this information, you could deduce that any values that aren’t whole numbers means that Chat failed to complete a step.
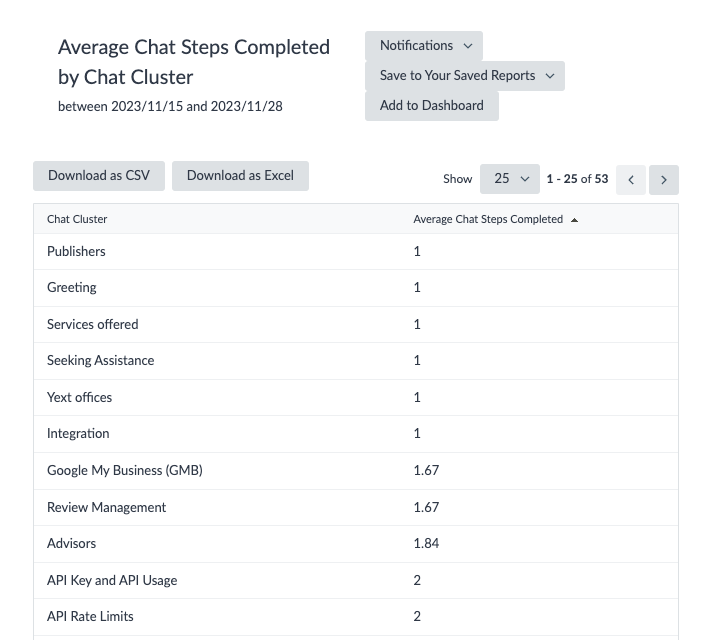
To set up this report:
- Chart Type: Table Chart
- Metrics: Average Chat Steps Completed
- Dimensions: Chat Cluster
- Filters: Internal User (Traffic Source) = No
From here, you can dive deeper into the report. Perhaps you are interested in how users are responding to the bot’s responses based on the thumbs up or down rate or if users are clicking the links that the bot is giving as part of an its answers. These are both metrics can add to your report.
What are some examples of Chat metrics and dimensions found in Report Builder? Select all that apply.
Climbing that leaderboard! 📈
