Listings Standard Insights | Yext Hitchhikers Platform
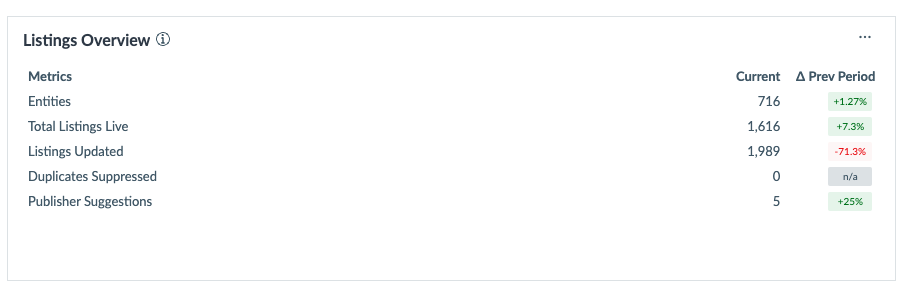
Listings Overview
Chart Type: Table
Key metrics for your locations and listings: Locations, Listings Live, Listing Updates, Duplicates Suppressed, and Publisher Suggestions. The percentage change is from the previous period of the same length (e.g. last 30 days would use the previous 30 days for comparison). The period length is controlled by the date range selected for the dashboard.
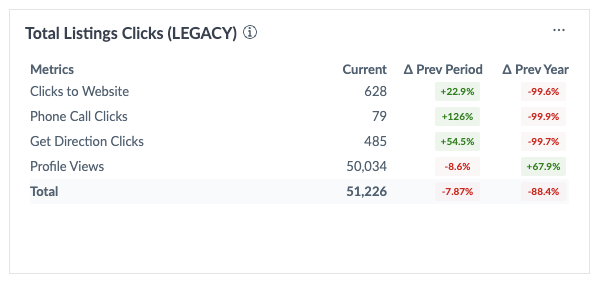
Total Listings Clicks (LEGACY)
Chart Type: Table
The number of times consumers interacted with your listing on Google and the broader network compared to the previous period and previous year.
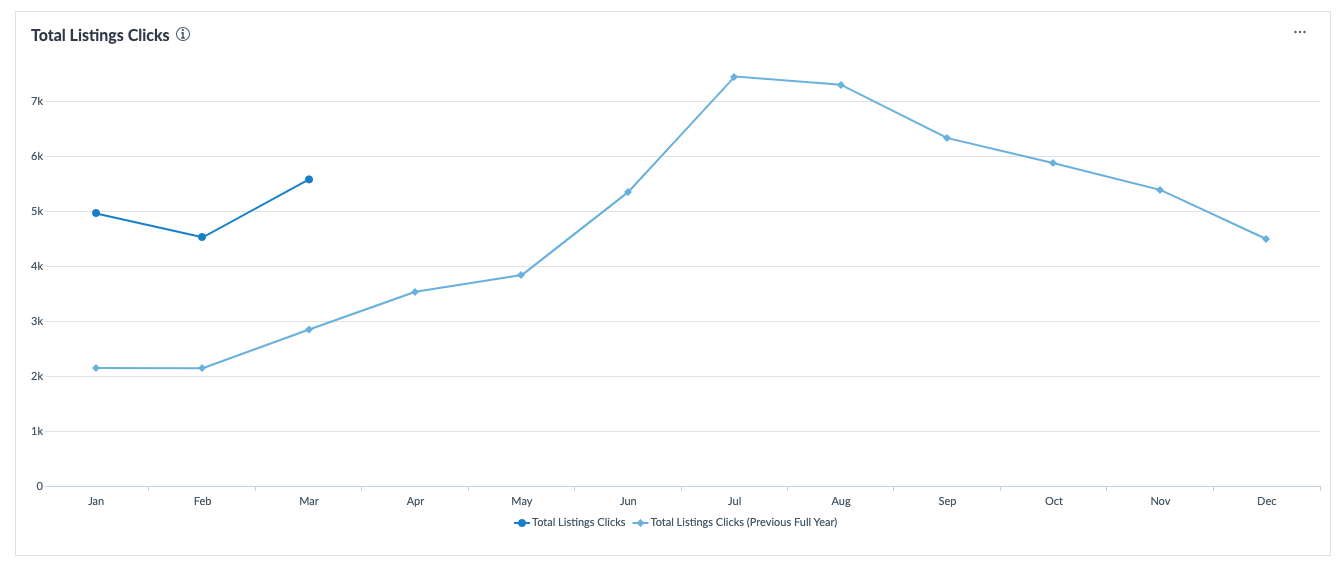
Total Listings Clicks (Comparative Line Chart)
Chart Type: Line Chart
The number of times consumers interacted with your listing compared to the previous year.
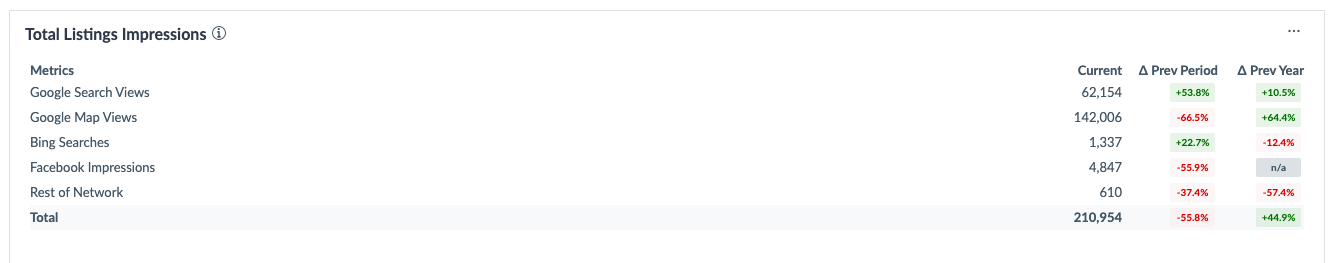
Total Listings Impressions (Table)
Chart Type: Table
The number of times your listing appeared in search results across Google Maps, Google Search, Bing, Facebook, and the broader network compared to the previous period and previous year.
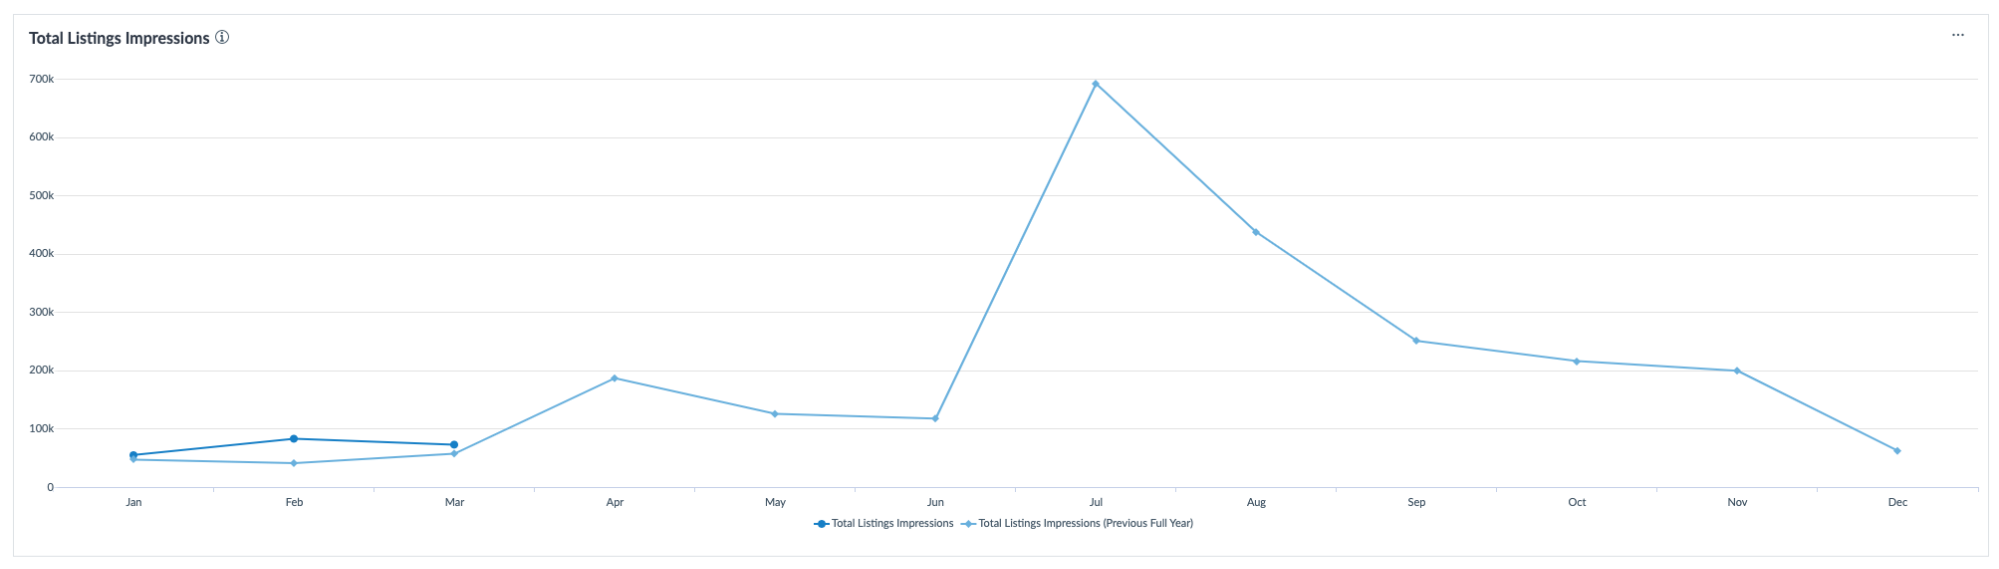
Total Listings Impressions (Line Chart)
Chart Type: Line Chart
The number of times your listing appeared in search results across Google Maps, Google Search, Bing, Facebook, and the broader network compared to the previous year.
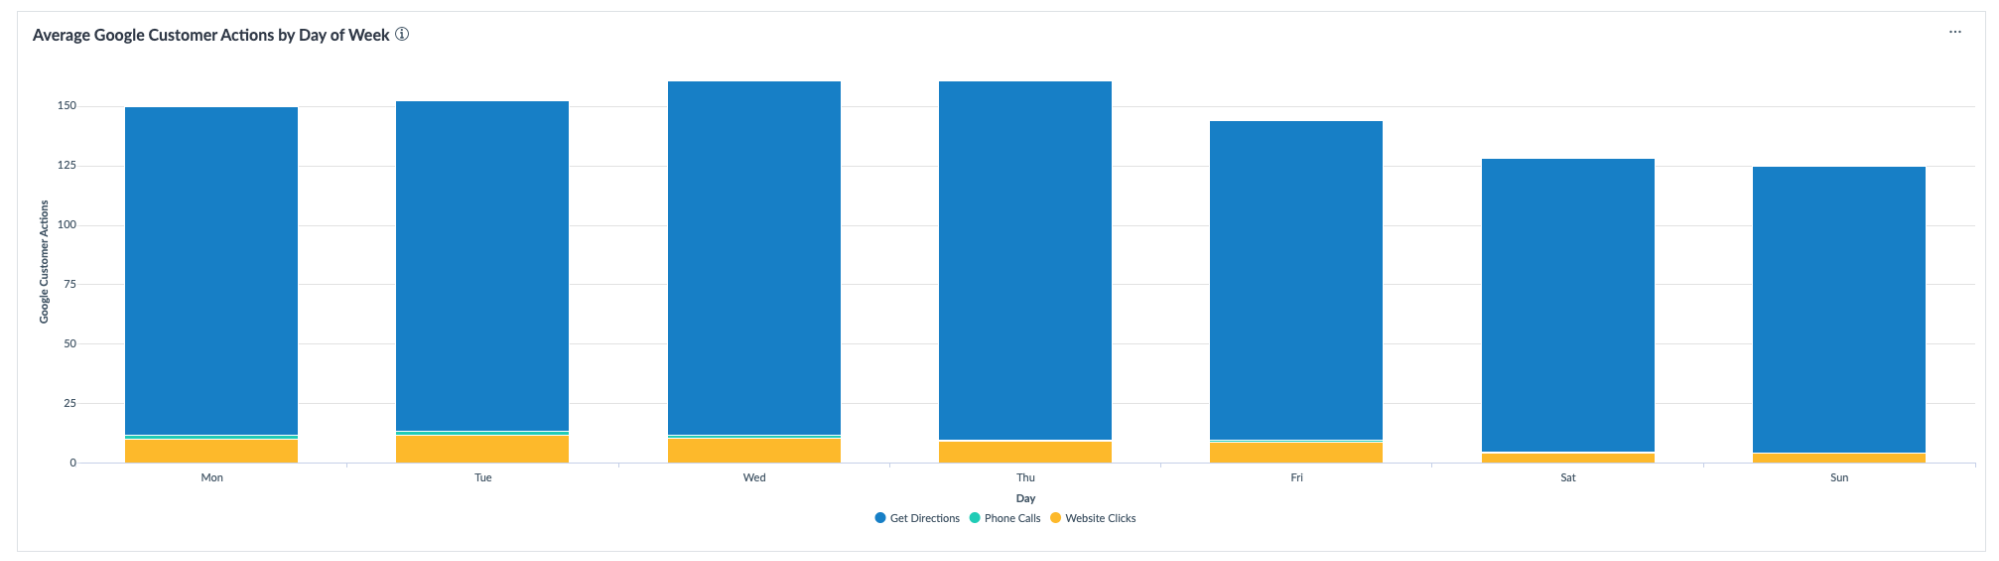
Average Google Customer Actions by Day of Week
Chart Type: Stacked Bar Chart
The average number of times consumers took action from your Google listing, each day of the week. These actions include clicking the Call, Directions, or Website links. A phone call action occurs when a consumer clicks the phone number on a mobile device, regardless of whether the phone call was completed.
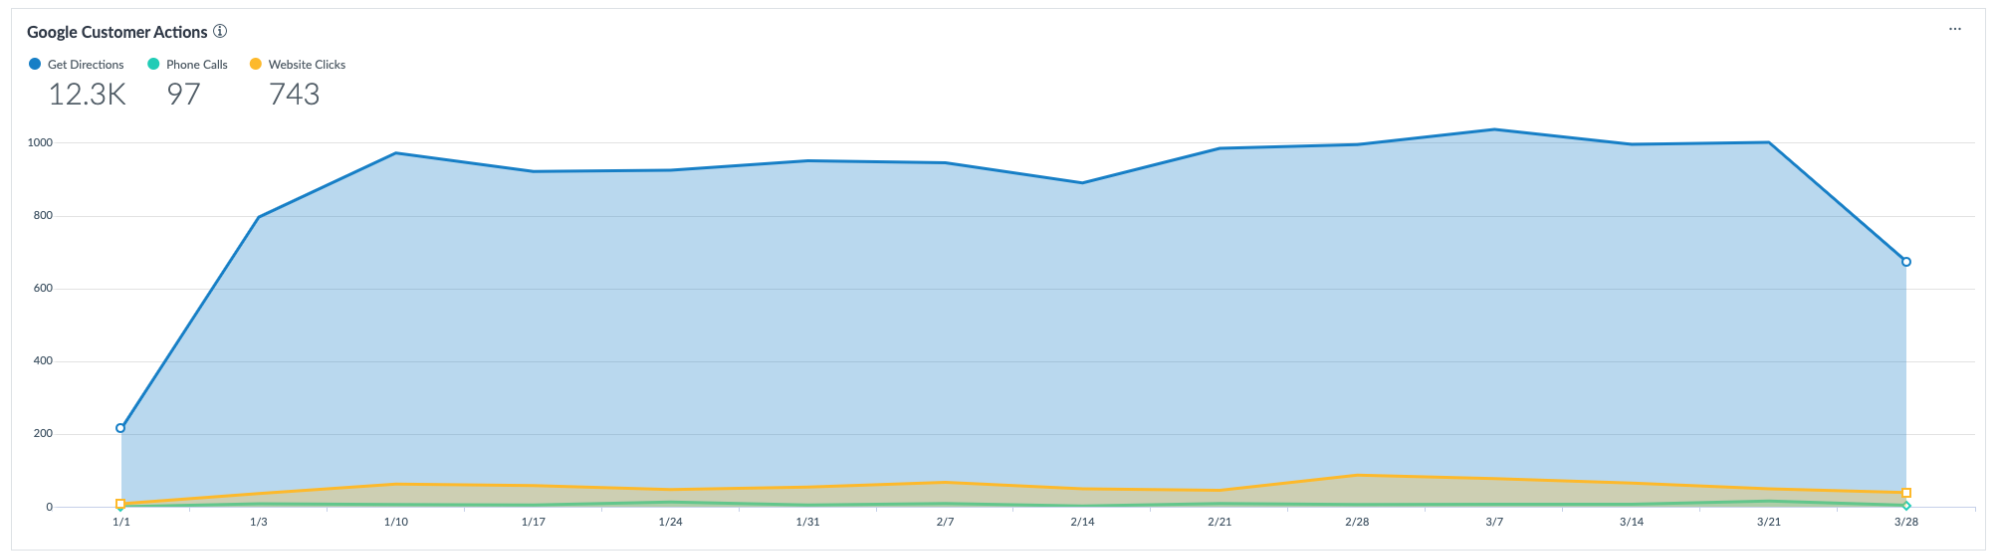
Google Customer Actions
Chart Type: Area Chart
The number of times consumers took action from your Google listing. These actions include clicking the Call, Directions, or Website links. A phone call action occurs when a consumer clicks the phone number on a mobile device, regardless of whether the phone call was completed.
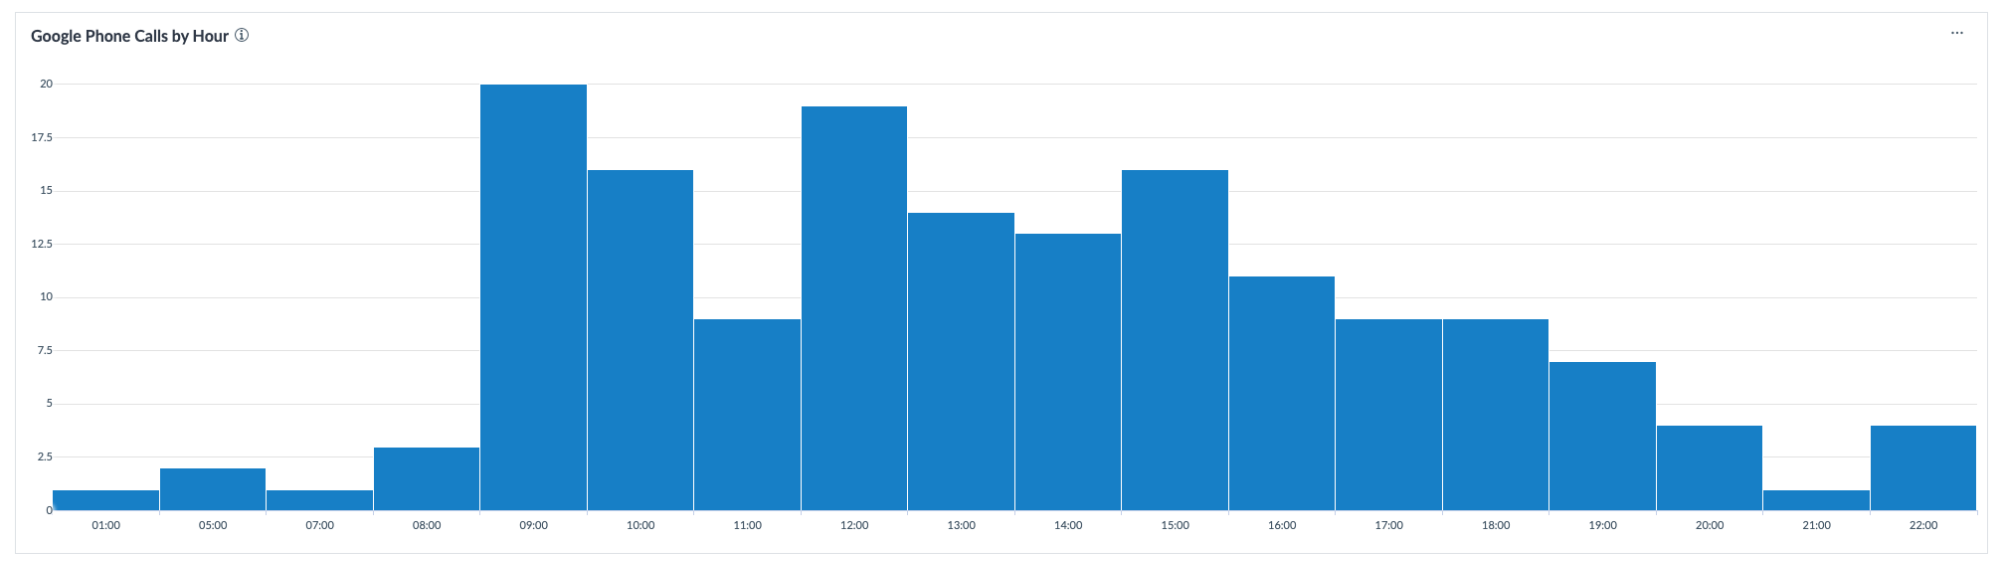
Google Phone Calls by Hour
Chart Type: Bar Chart
The number of times consumers clicked the Call link on your Google listing from a mobile device, broken down by the hour of the day (in the location’s time zone). This metric tracks when a consumer clicks the phone number on a mobile device, regardless of whether the phone call was completed. This insight always uses the last 90 days as the time period regardless of the date filter.
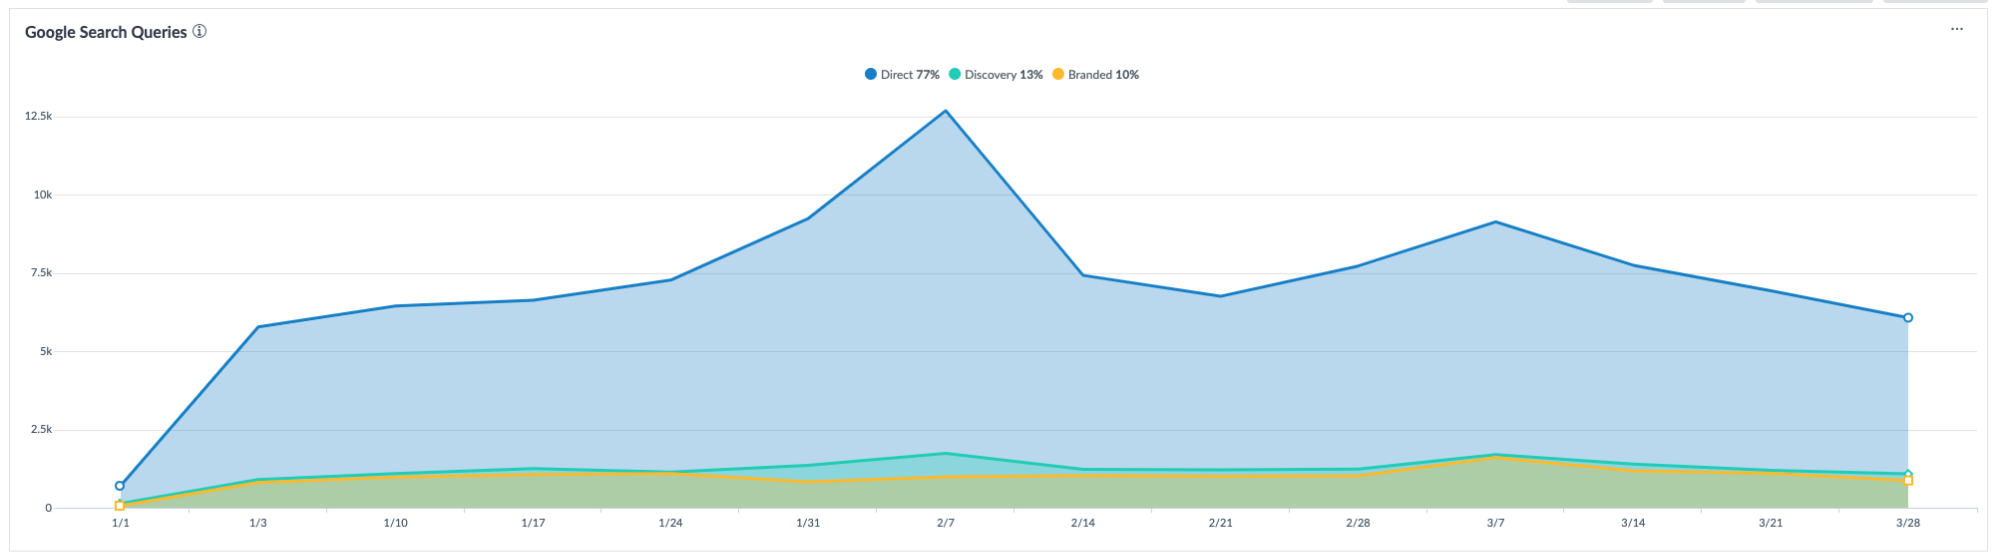
Google Search Queries
Chart Type: Area Chart
The number of search queries that lead to Discovery result (list of locations) and the number of search queries that resulted in a Direct result (a single location). In organic search a Discovery result displays as a Local Pack and a Direct result displays as a Knowledge Card.
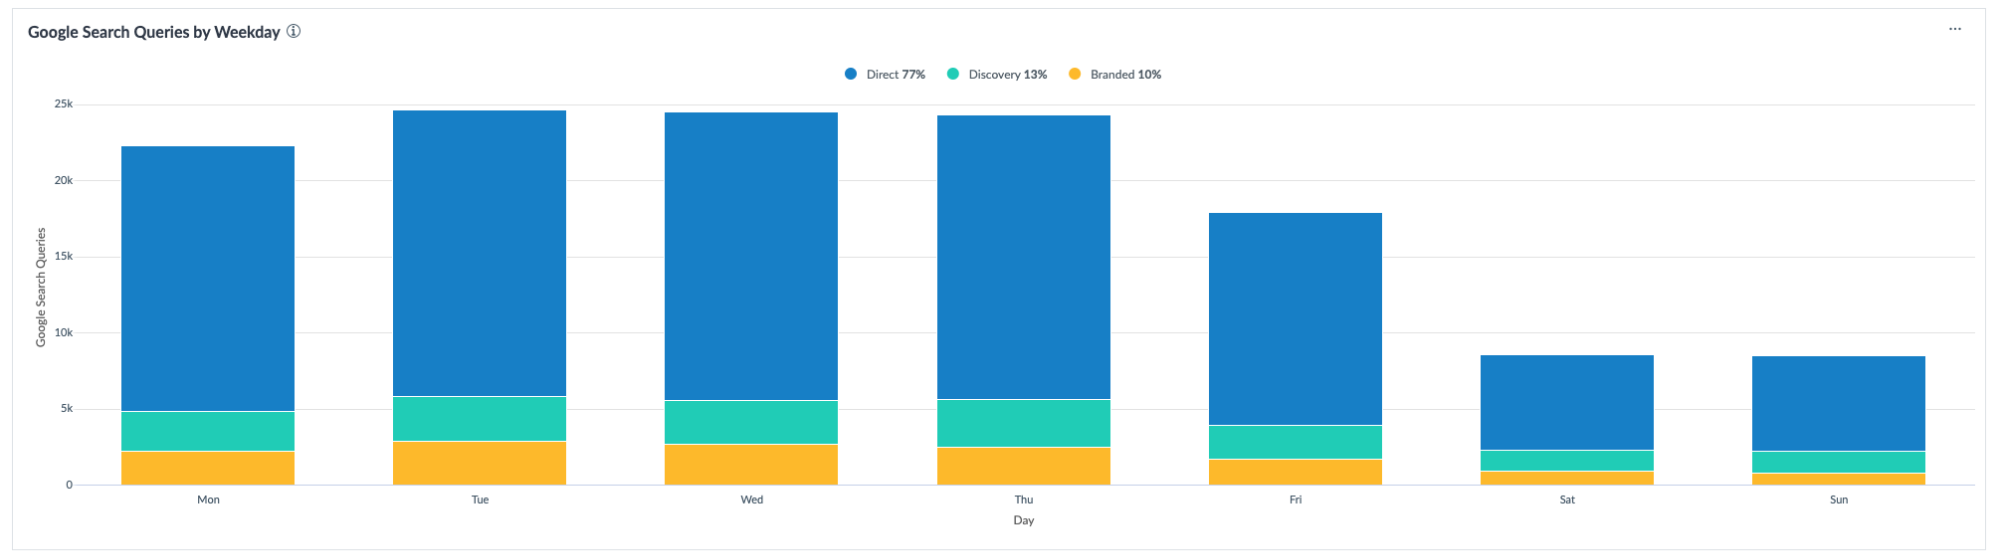
Google Search Queries by Weekday
Chart Type: Bar Chart
The number of search queries that lead to Discovery result (list of locations) and the number of search queries that resulted in a Direct result (a single location) broken down by day of the week. In organic search a Discovery result displays as a Local Pack and a Direct result displays as a Knowledge Card.
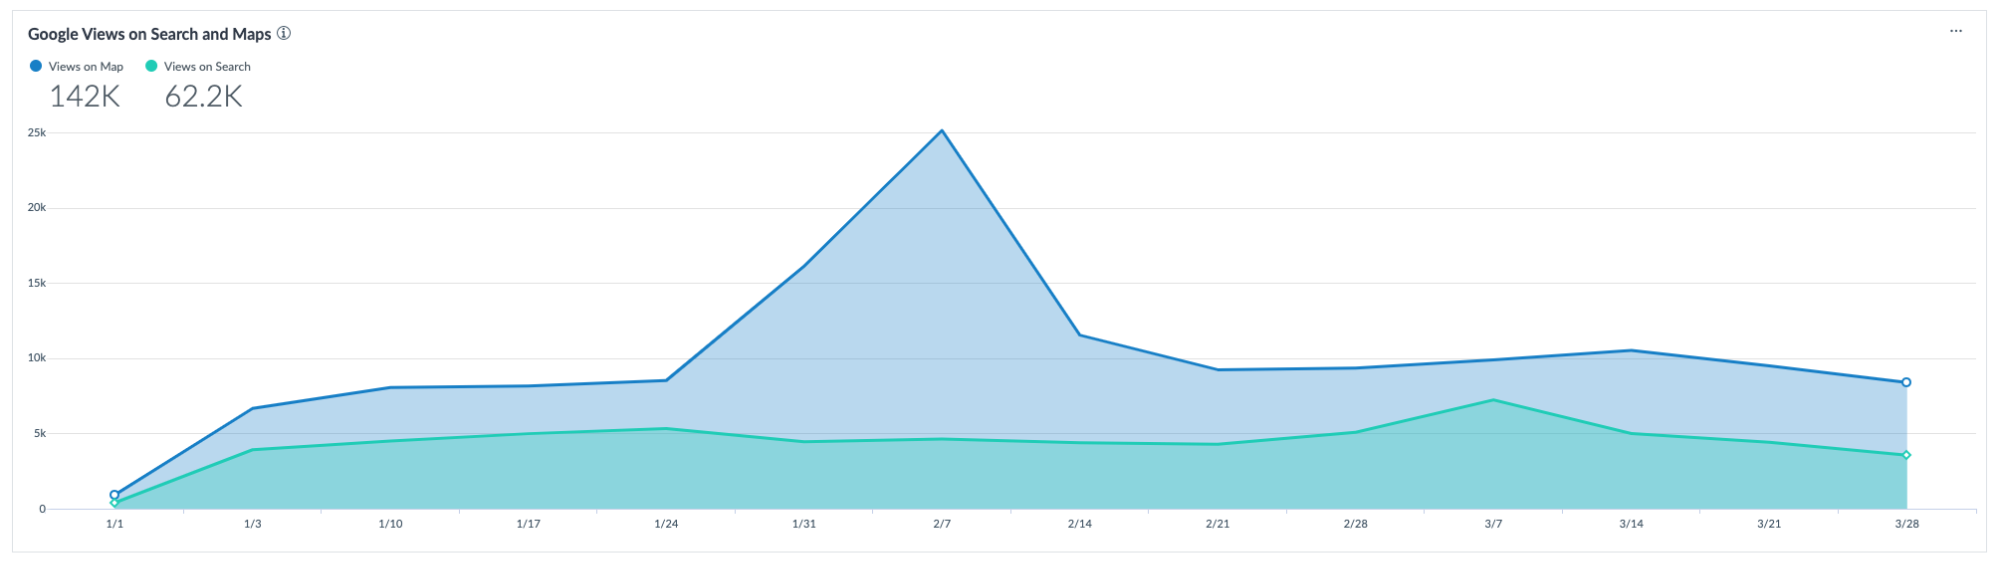
Google Views on Search and Maps
Chart Type: Area Chart
The number of times your listing appeared in search results specifically on Google Search and Google Maps.
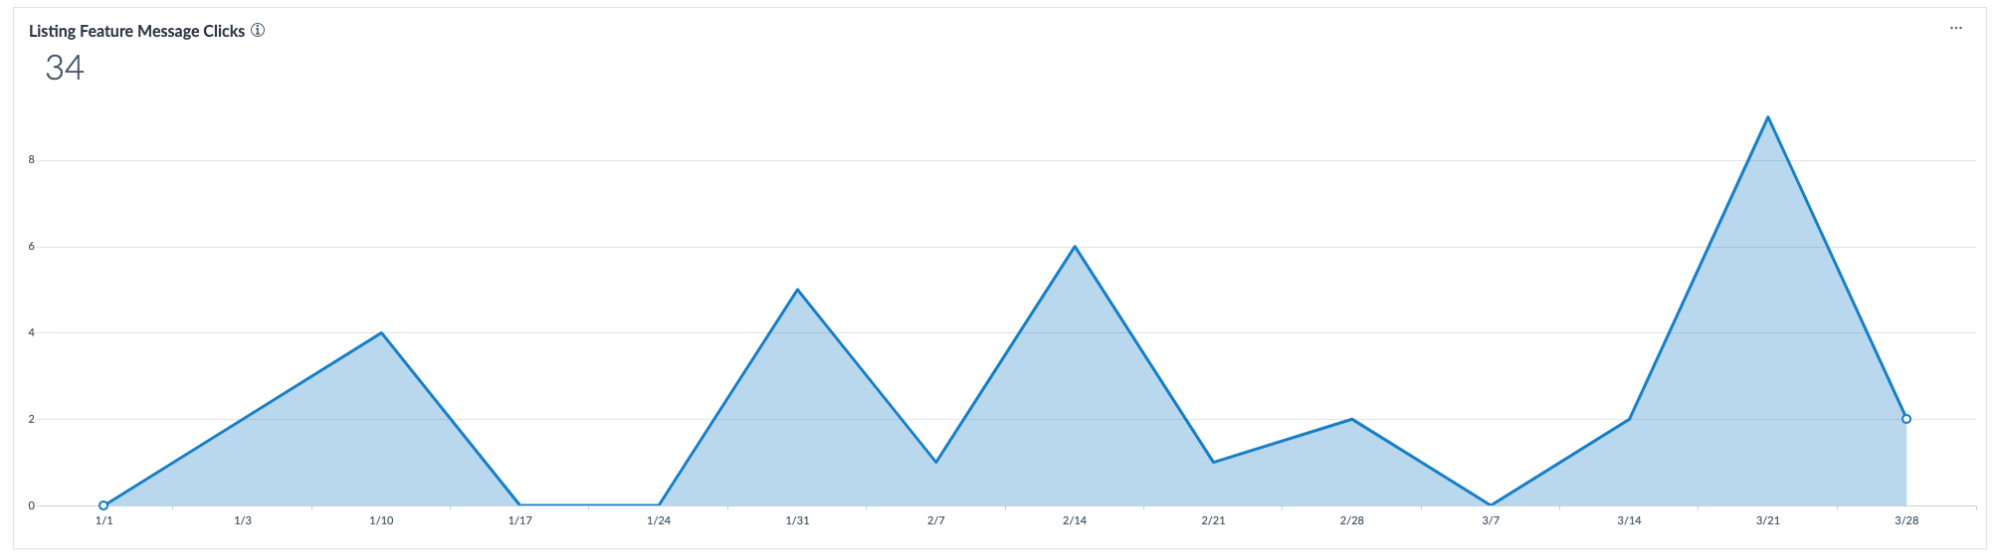
Listing Featured Message Clicks
Chart Type: Area Chart
The number of times consumers clicked on your Featured Message on any of our network sites that support clickable Featured Messages.
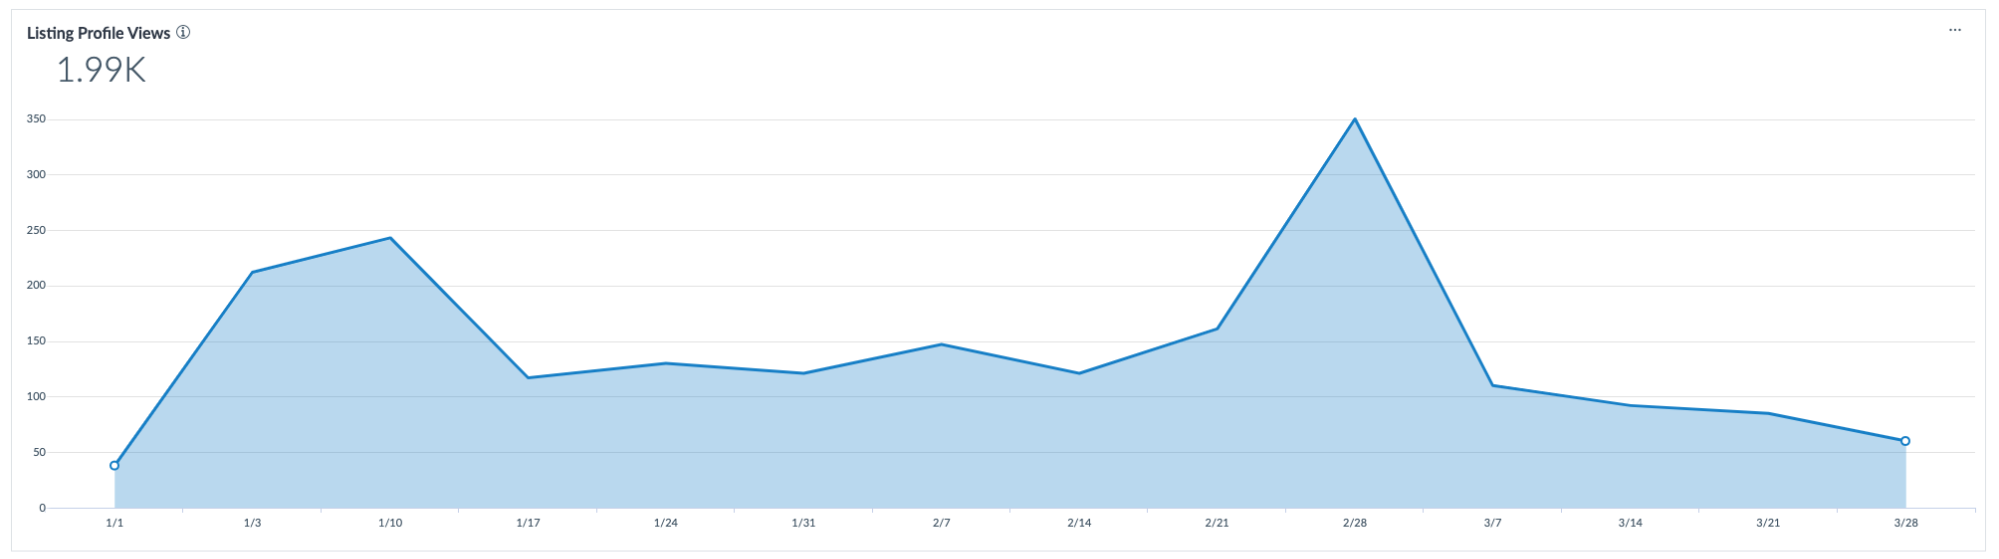
Listing Profile Views
Chart Type: Area Chart
The number of times consumers viewed your full listings profile on any of our network sites. Does not include Google, Bing, or Yelp.
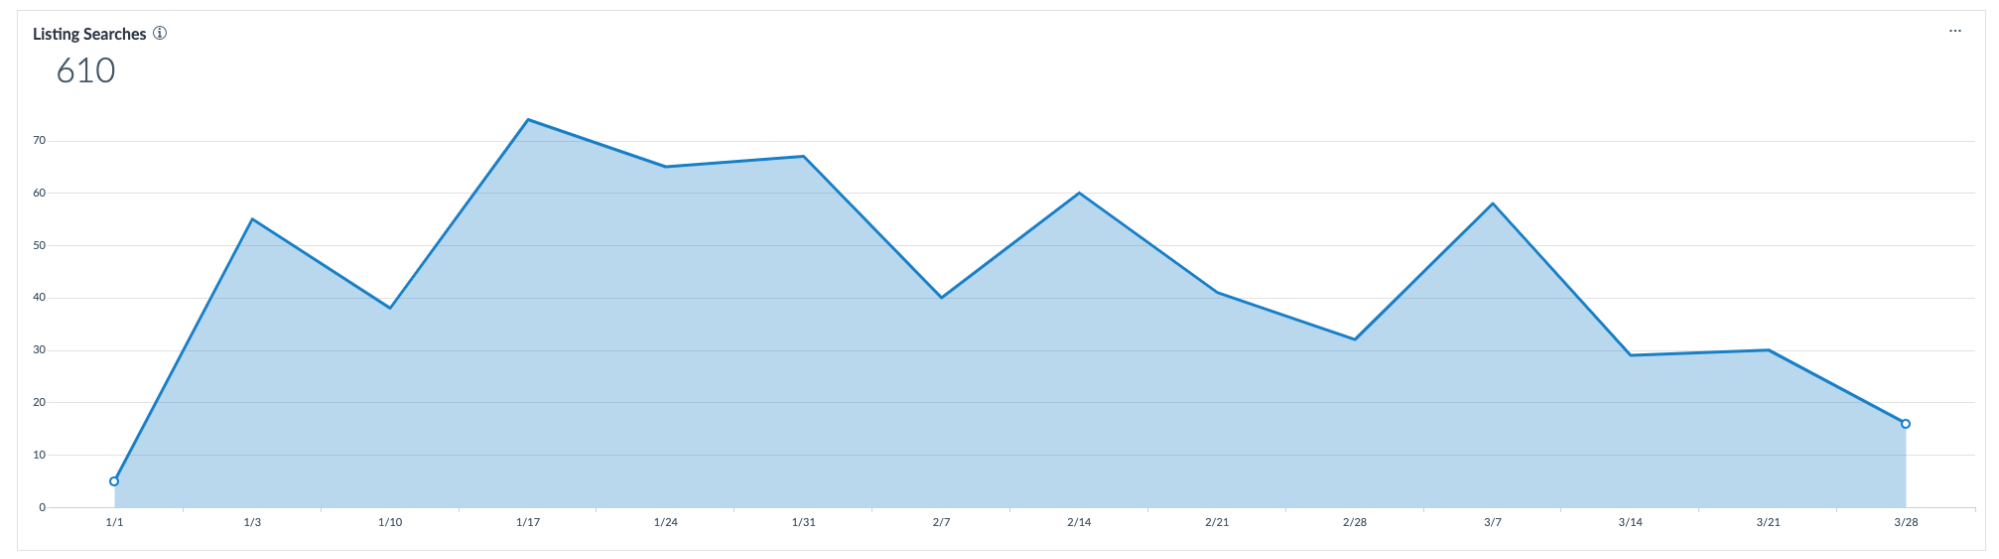
Listing Searches
Chart Type: Area Chart
The number of times your listing appeared in search results on our network sites. Does not include searches on Google, Bing, Yelp or Facebook.
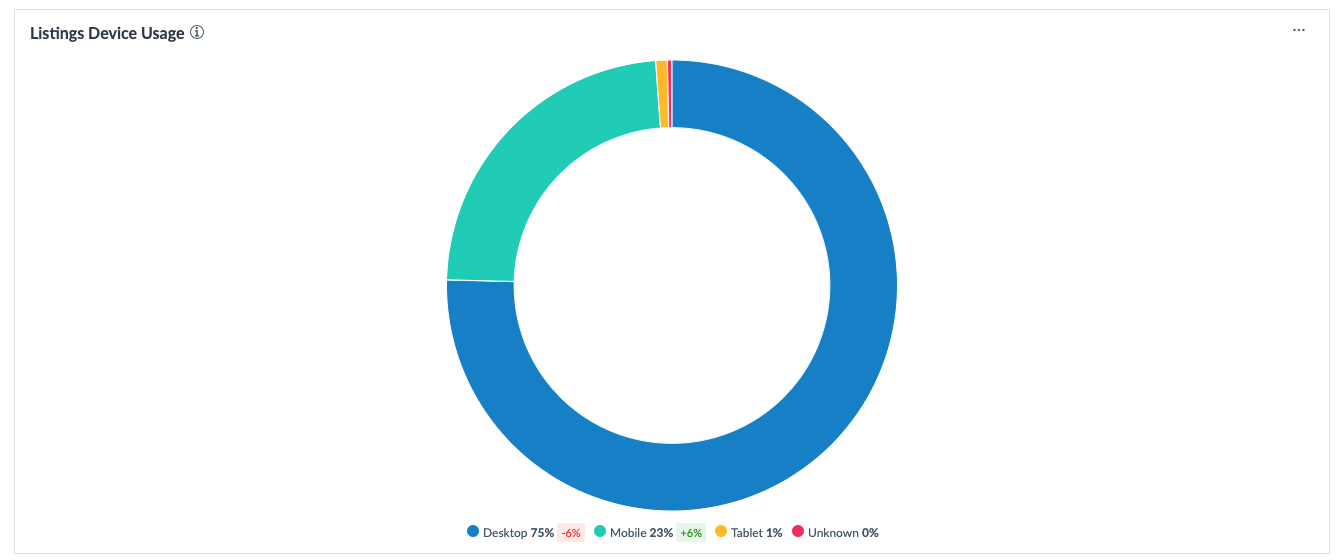
Listings Device Usage
Chart Type: Donut Chart
The number of times your listing appeared in search results on each device type (Desktop, Mobile, Tablet, or Unknown). Unknown is when we were unable to determine the device type. Device usage is pulled from a sample of network sites.
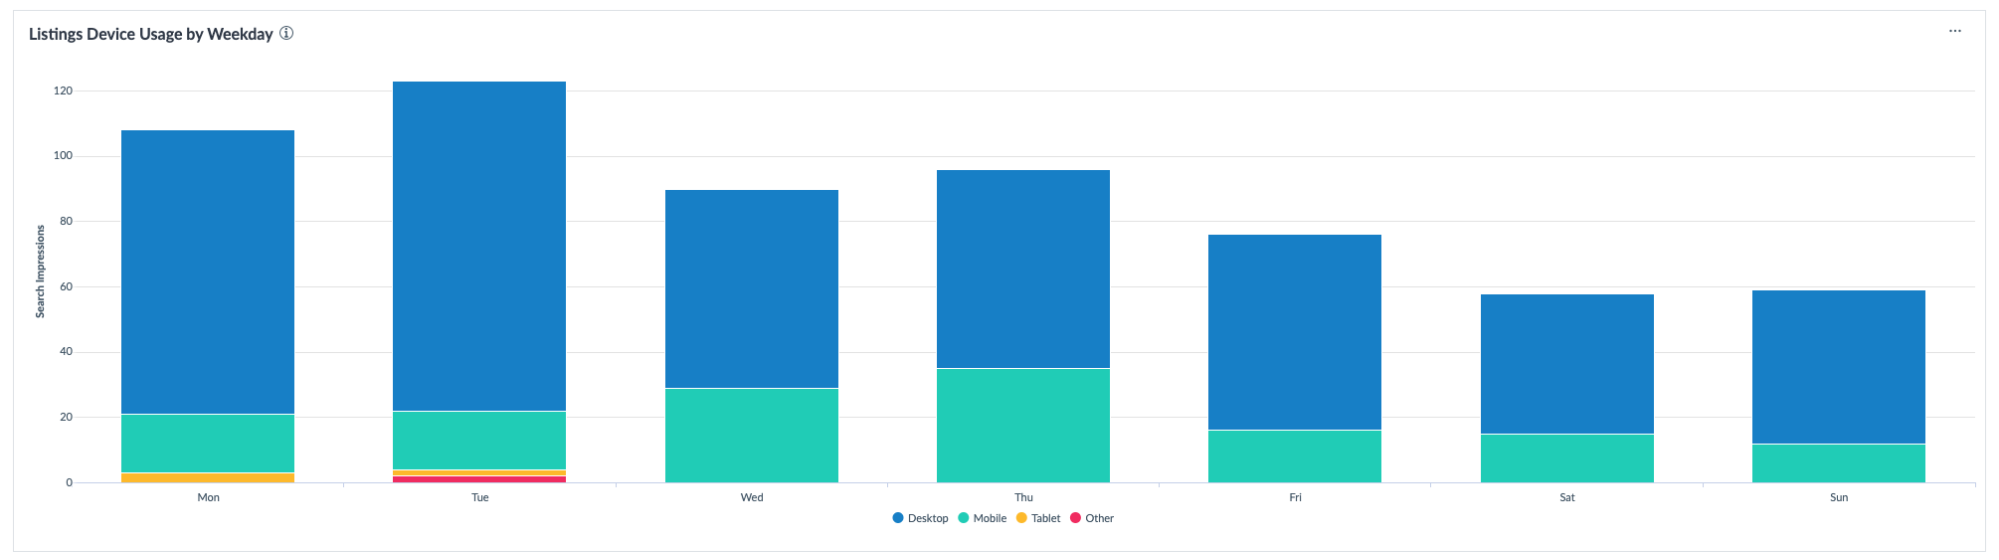
Listings Device Usage by Weekday
Chart Type: Stacked Bar Chart
The number of times your listing appeared in search results on each device type (Desktop, Mobile, Tablet, or Unknown), broken down by day of the week. Unknown is when we were unable to determine the device type. Device usage is pulled from a sample of network sites.
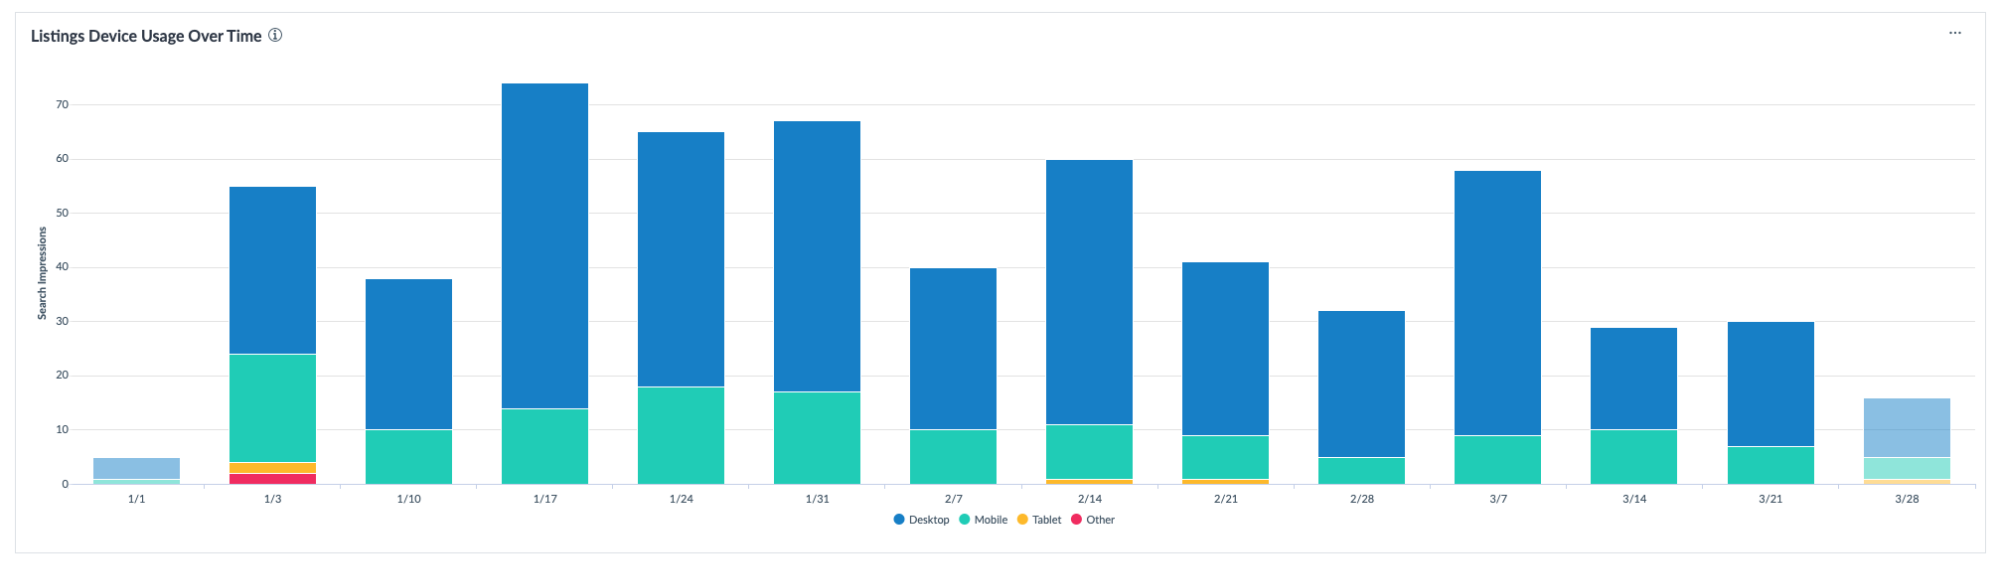
Listings Device Usage Over Time
Chart Type: Stacked Bar Chart
The number of times your listing appeared in search results on each device type (Desktop, Mobile, Tablet, or Unknown) and how this is changing over time. Unknown is when we were unable to determine the device type. Device usage is pulled from a sample of network sites.
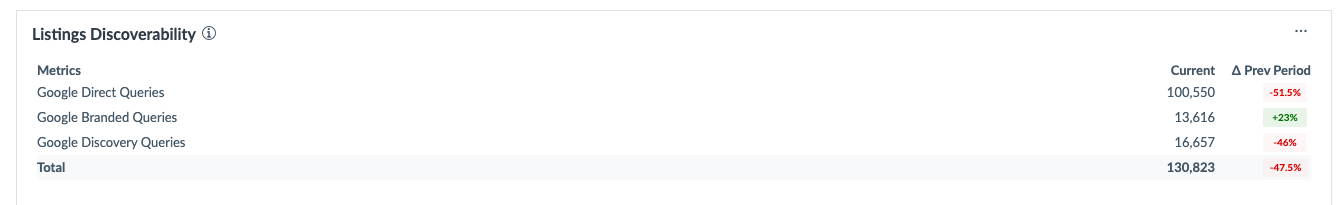
Listings Discoverability (LEGACY)
Chart Type: Table
The number of times your listing was shown in a Google search.
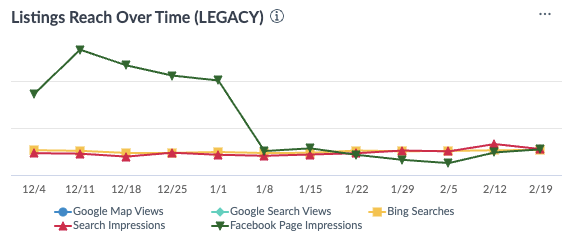
Listings Reach Over Time (LEGACY)
Chart Type: Line Chart
The number of times your listings appeared in search results across Google Maps, Google Search, Bing, Facebook, and the broader network. Metrics are displayed on independent axes, so there is no overall scale in this insight. Bing is only displayed if the date range is at least 90 days.
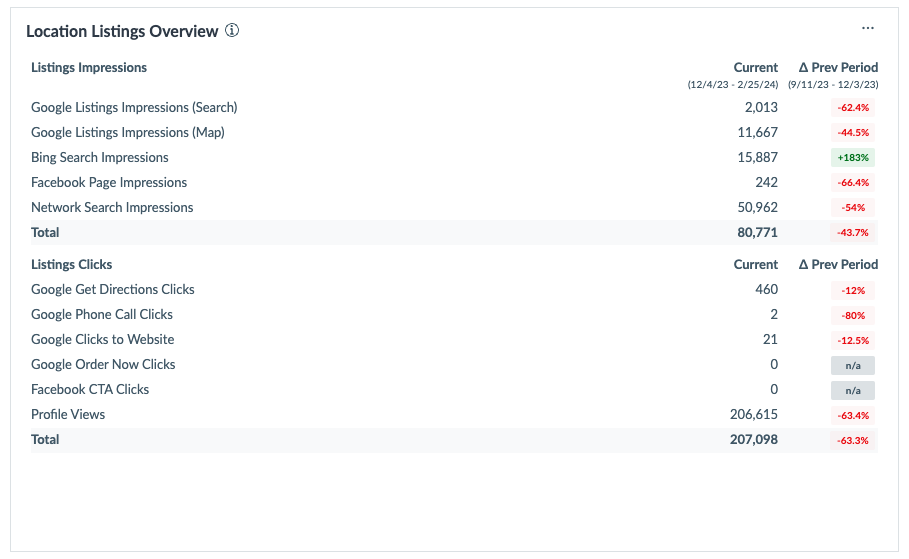
Location Listings Overview
Chart Type: Table
The number of times your listings appeared in search results across Google Maps, Google Search, Bing, Facebook, and the broader network. The percentage change is from the previous period of the same length (e.g. last 30 days would use the previous 30 days for comparison).
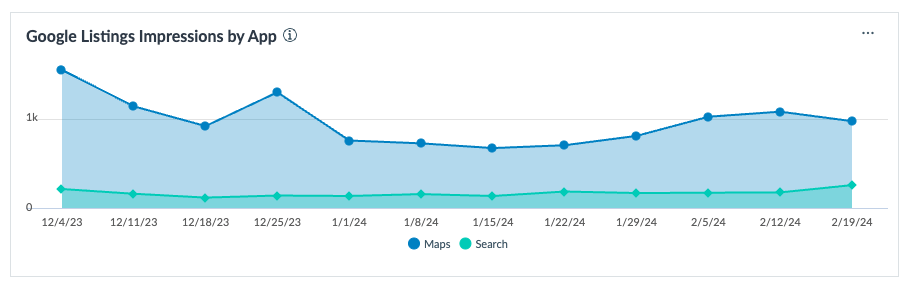
Google Listings Impressions by App
Chart Type: Area Chart
The number of times your listing appeared on Google Search and Google Maps.
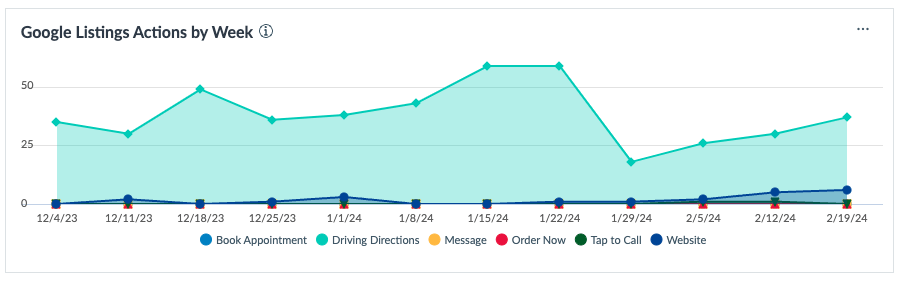
Google Listings Actions by Week
Chart Type: Area Chart
The number of times consumers took action from your Google listing. These actions include clicking the links including Call, Directions, Website, etc. A phone call action occurs when a consumer clicks the phone number on a mobile device, regardless of whether the phone call was completed.
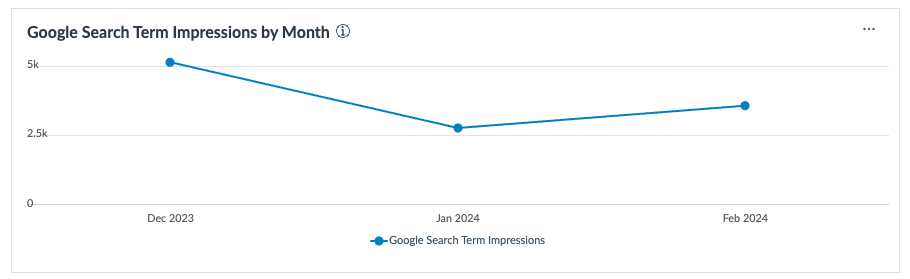
Google Search Term Impressions by Month
Chart Type: Line Chart
The number of times search keywords were used to find your business in Google Search or Google Maps per month.
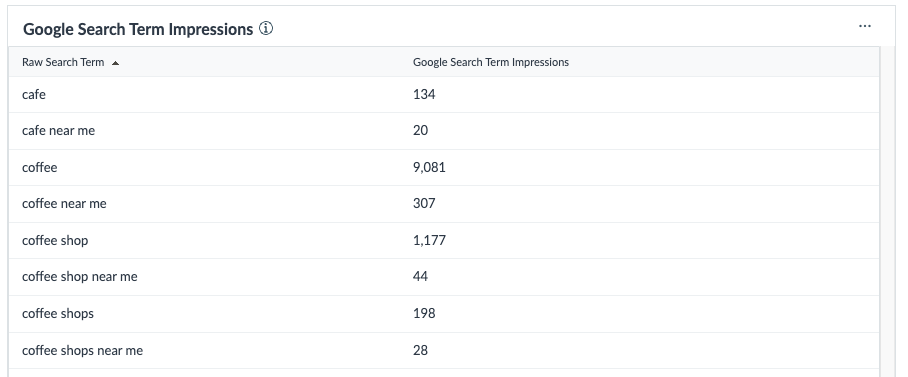
Google Search Term Impressions
Chart Type: Table
The number of times search keywords were used to find your business in Google Search or Google Maps.
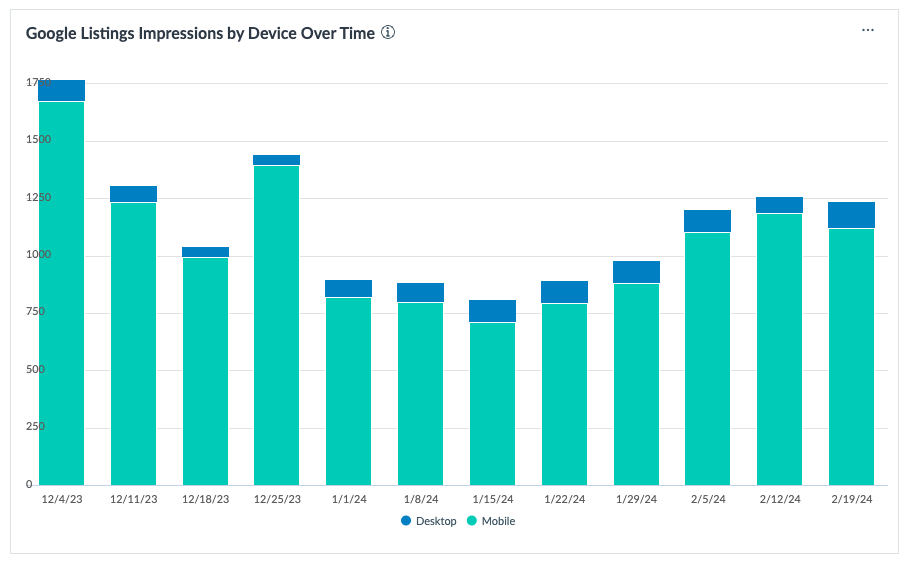
Google Listings Impressions by Device Over Time
Chart Type: Stacked Bar Chart
The number of times your listing appeared on Google Search and Google Maps on each device type per week.
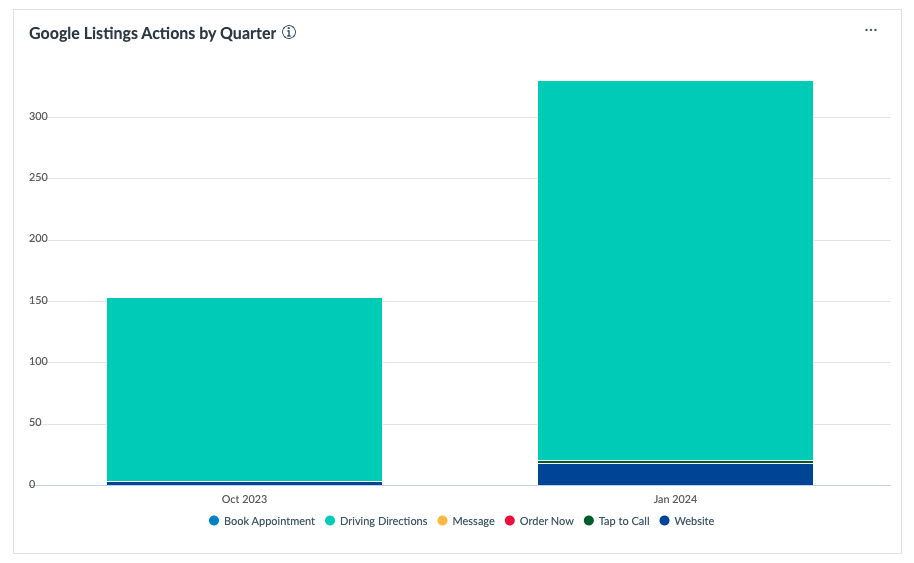
Google Listings Actions by Quarter
Chart Type: Stacked Bar Chart
The number of times consumers took action from your Google listing. These actions include clicking the links including Call, Directions, Website, etc. A phone call action occurs when a consumer clicks the phone number on a mobile device, regardless of whether the phone call was completed.
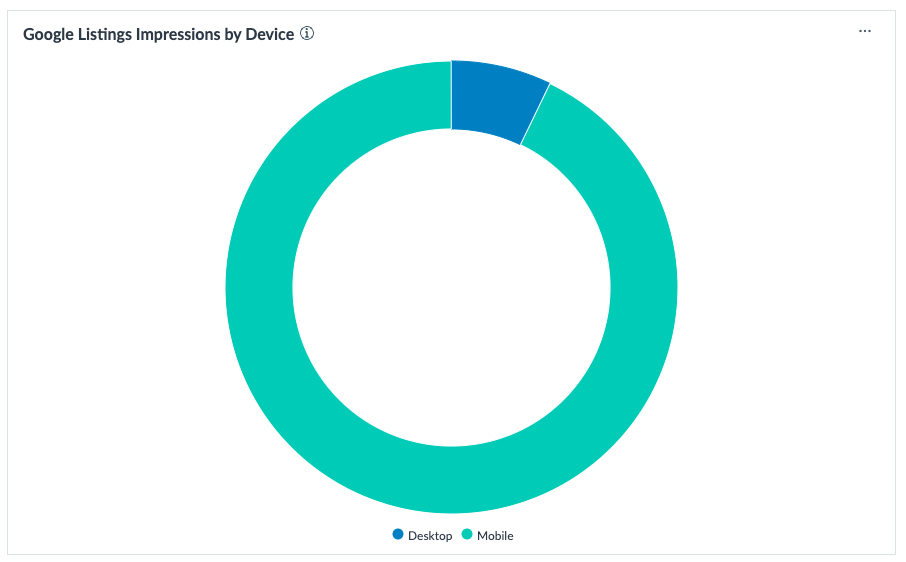
Google Listings Impressions by Device
Chart Type: Donut Chart
The number of times your listing appeared on Google Search and Google Maps on each device type.
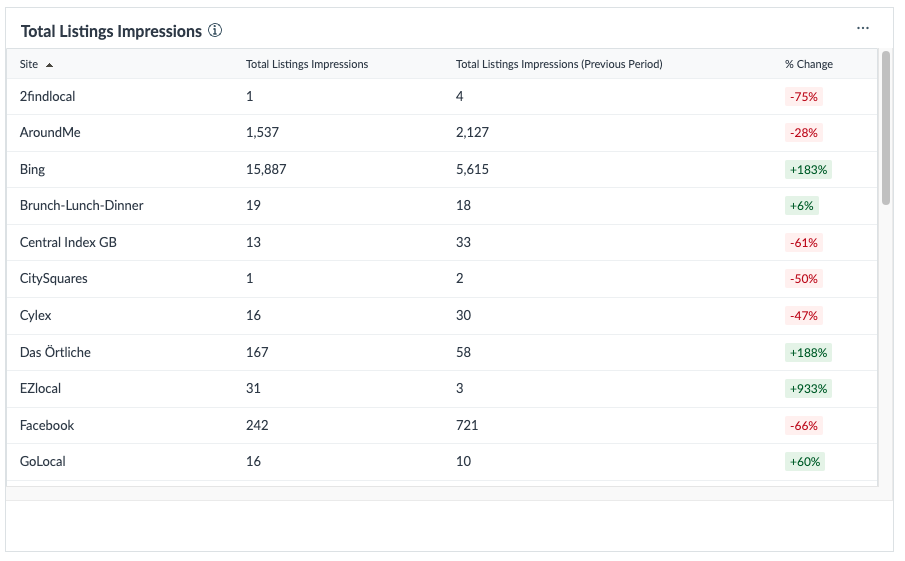
Total Listings Impressions
Chart Type: Table
The number of times your listings appeared in search results across Google, Bing, Facebook, and the broader network. The percentage change is from the previous period of the same length (e.g. last 30 days would use the previous 30 days for comparison). The period length is controlled by the date range selected for the dashboard.
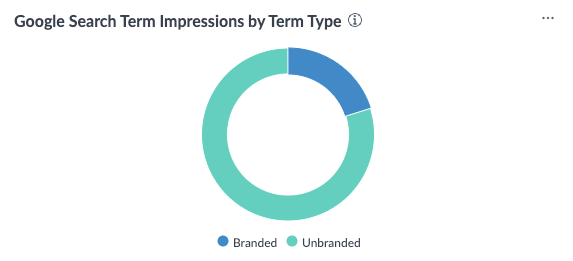
Google Search Term Impressions by Term Type
Chart Type: Donut Chart
The number of times search keywords were used to find your business in Google Search or Google Maps, by search term type. These can be either Branded or Unbranded terms.