Listings Insights | Yext Hitchhikers Platform
Overview
Listings Insights provides information about the impact and ROI of listings, as well as local performance of listings compared to competitors.
There are three components to Listings Insights:
- Performance: A visual funnel of listings conversions, using analytics information from Listings action types and user-settable ROI and cost per click metrics. This screen is available to all Listings clients.
- Visibility: Reports on listings presence, competitor presence, and keyword performance. This screen is available to clients with a Competitive Intelligence subscription.
- Map: An interactive geographical view of the data on the Visibility screen. This screen is available to clients with a Competitive Intelligence subscription.
To learn how to customize the conversion rate and revenue estimates on the Performance tab of Listings Insights, see the Set Your Conversion and Revenue Estimates on Listings Insights help article.
For an overview of all the Search Tracker metrics displayed on the Visibility and Map sections of Listings Insights, see the Search Tracker Metrics reference documentation.
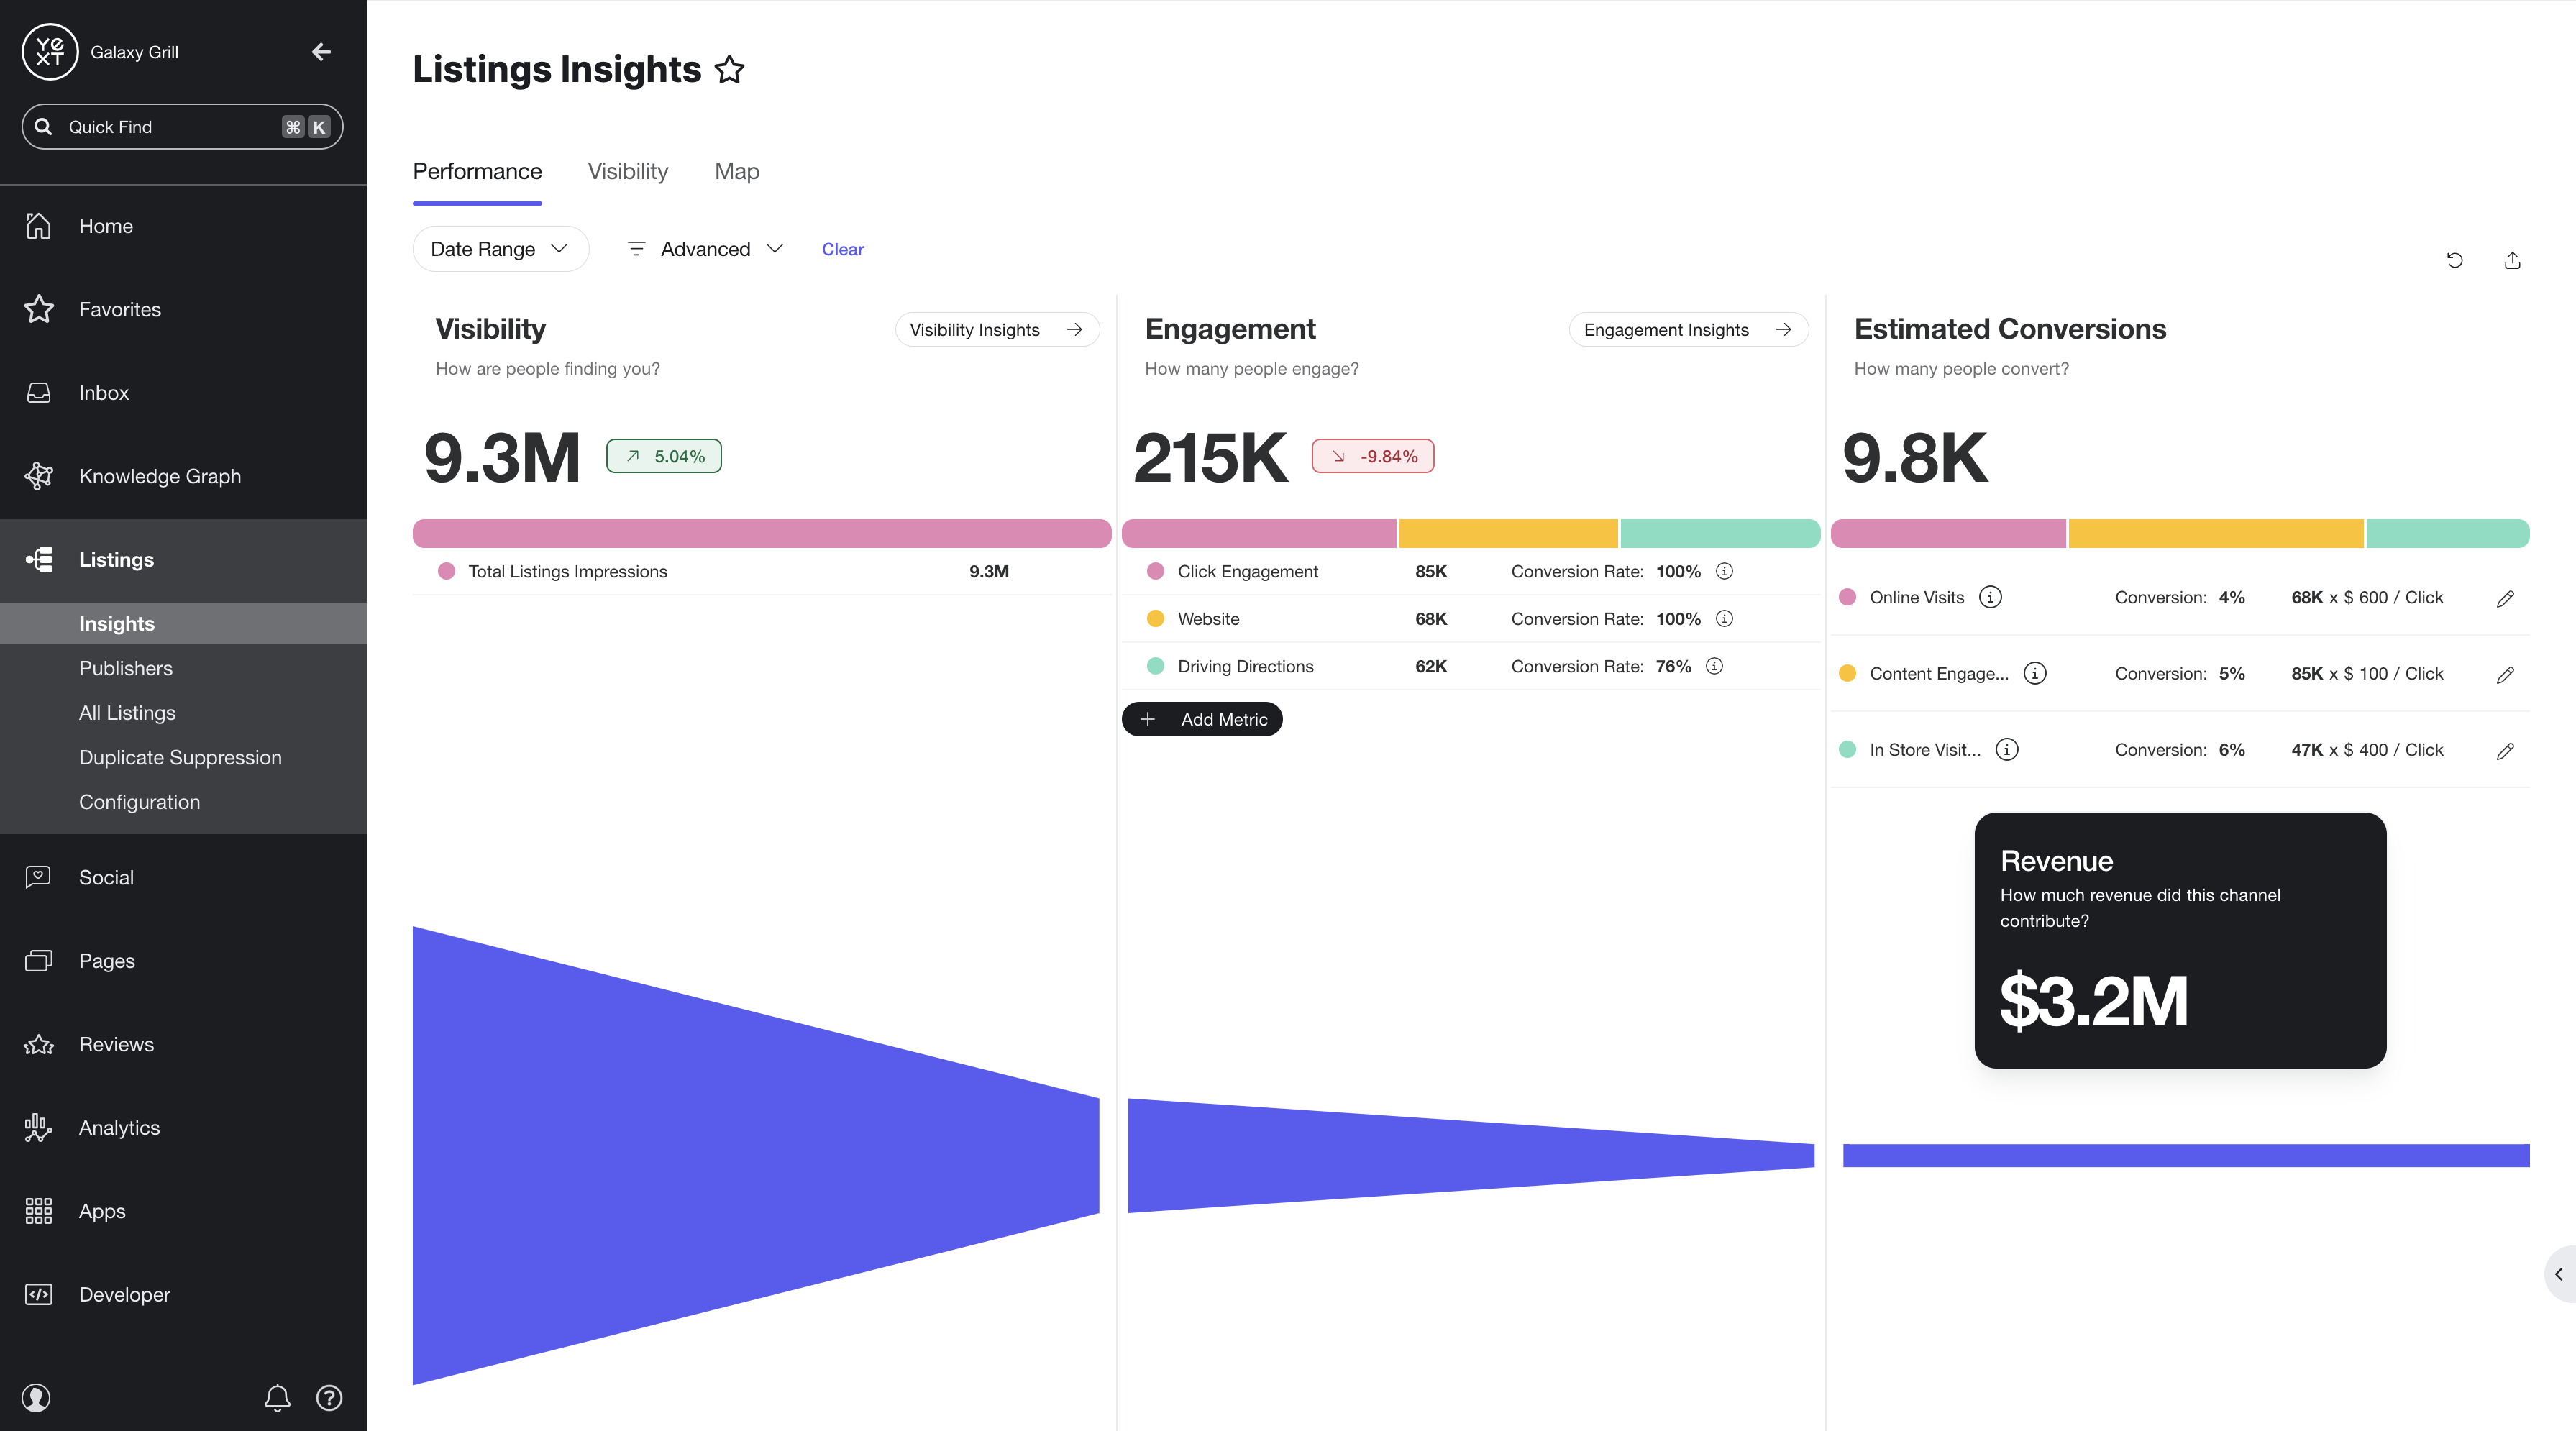
Performance
The Performance screen displays a funnel of listings visbility (total Listings impressions), engagement (actions taken on listings), and estimated conversions (online and in-store visits, digital leads, and content engagement).
Filter the Performance screen by:
- Date range (last 30, 60, or 90 days; last year; custom range)
- Advanced options (entity or folder criteria)
Visibility
The Visibility stage of the funnel reflects the Total Listings Impressions metric for listings corresponding to the selected entities within the selected time frame. Total Listings Impressions refers to the number of times a listing appeared in search results across Google Maps, Google Search, Facebook, and the broader Publisher Network.
The Visibility Insights CTA is clickable to open a drawer with detailed metrics on the total listings impressions:
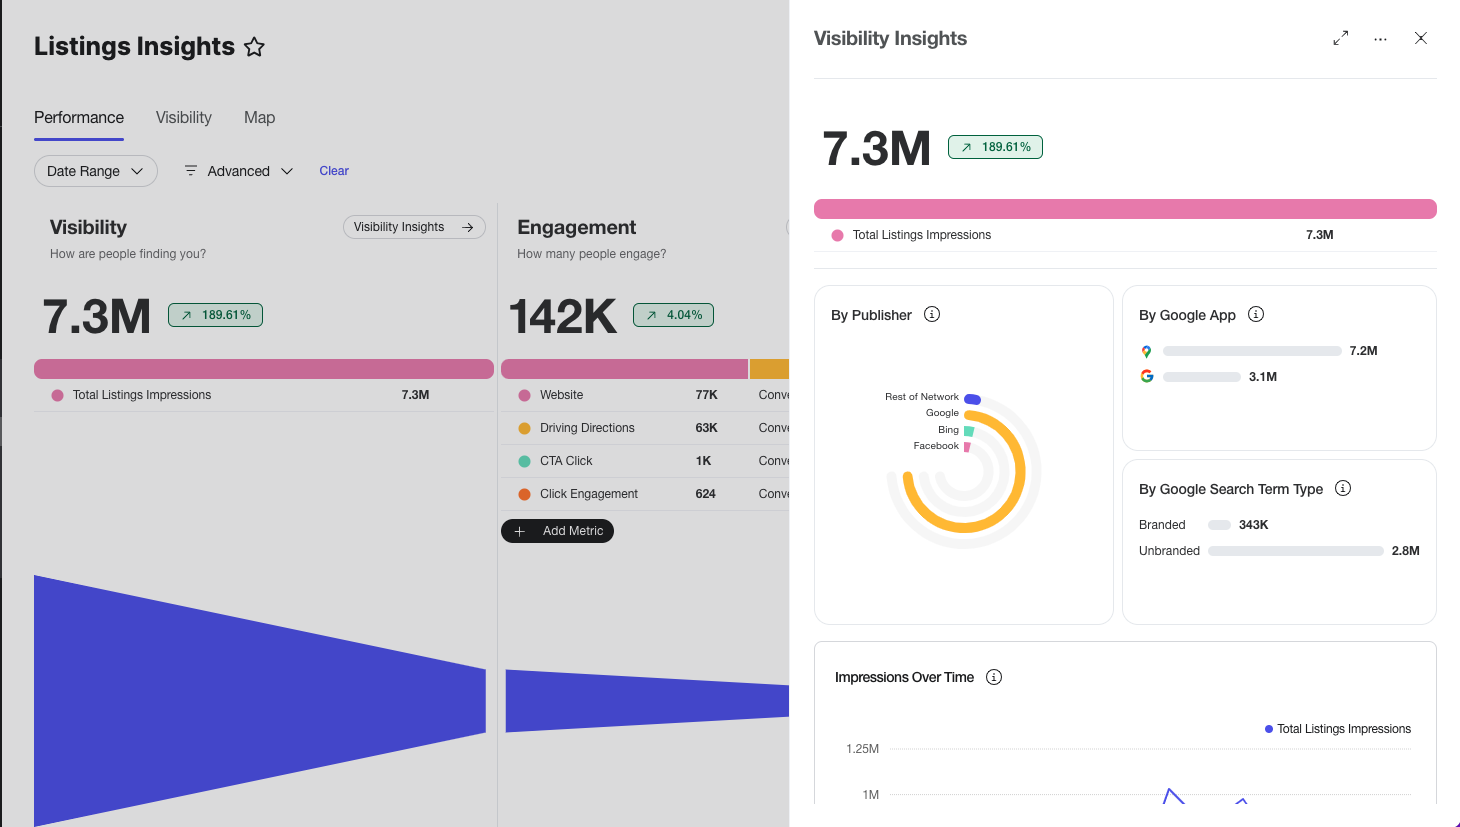
- The change compared to the previous time period is indicated by the icon next to the Visibility hero metric.
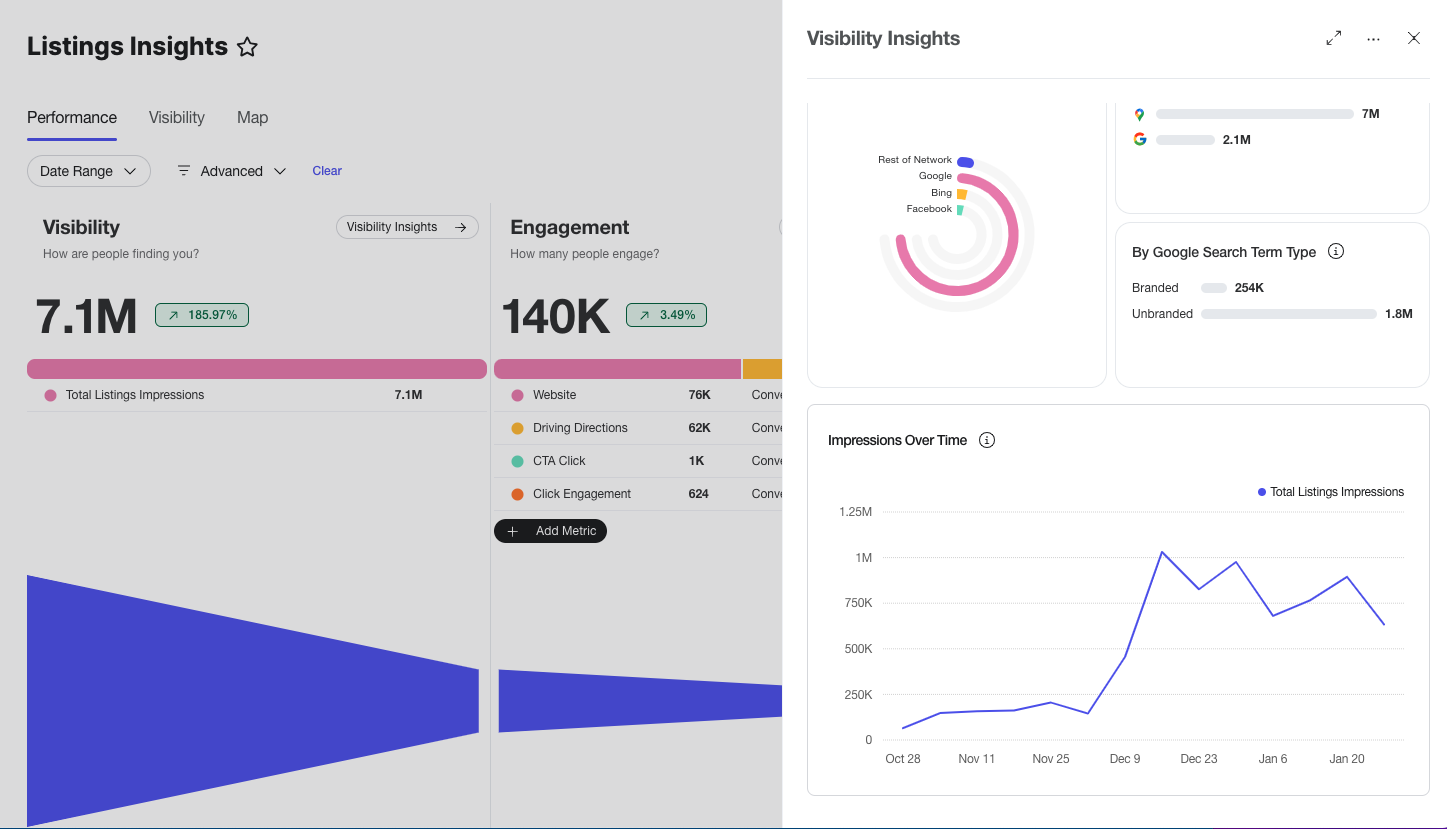
- By Publisher: View a breakdown of the listings impressions attributed to Google (Maps and Search), Facebook, and the rest of the Publisher Network. Hover over each ring for an exact number.
- By Google App: See how many listings impressions were attributed to listings found via Google Search vs. Google Maps.
- By Google Search Term Type: See how many listings impressions were attributed to listings found using branded vs. unbranded search terms (e.g. “Galaxy Grill near me” vs. “restaurants near me”)
- Impressions Over Time: See the change in the Total Listings Impressions metric over the selected time period.
Engagement
The Engagement stage of the funnel reflects actions taken by users on the listings displayed for the selected entities and date range.
By default, the Engagement stage will display the Website, Driving Directions and Click Engagement actions. For each action, the Engagement stage shows:
- The total number of each action
- The conversion rate for each action (the percentage of users who took the action and completed the corresponding conversion type in the Estimated Conversion stage of the funnel)
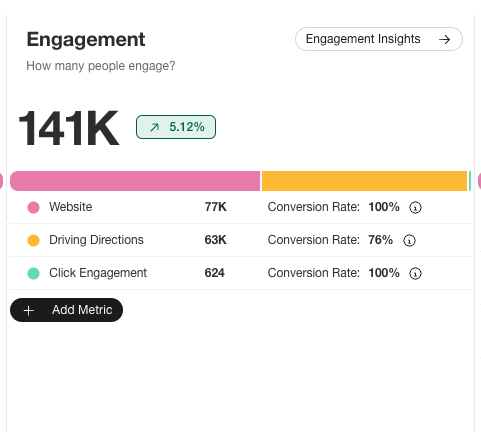
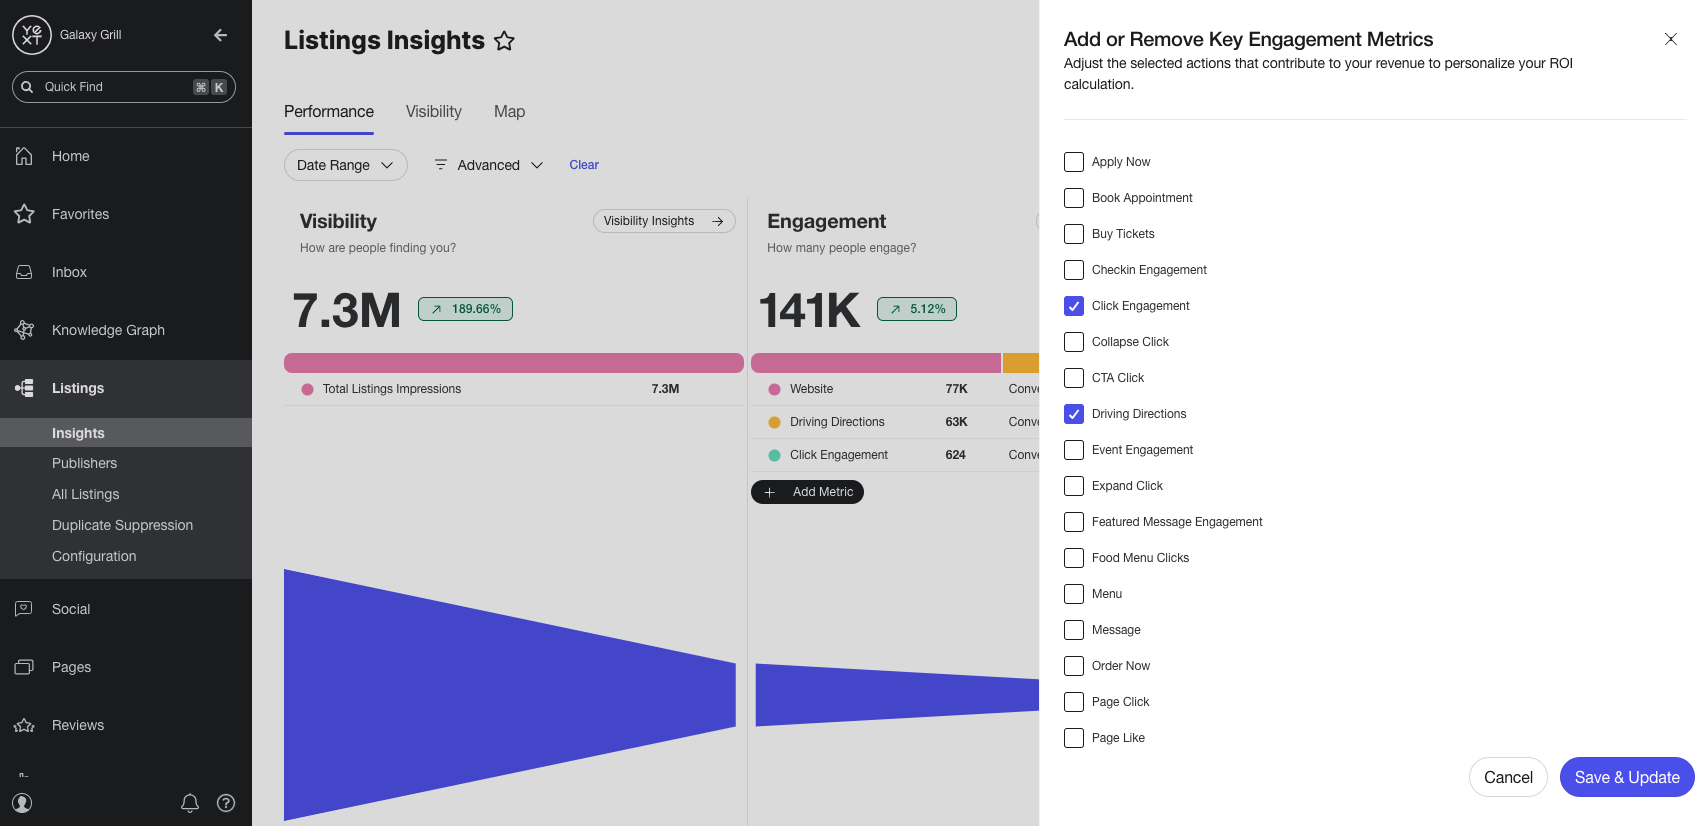
Click the Add Metric button to add or remove specific actions (see the Engagement and Conversion Metrics section for a breakdown of the available actions).
Like the Visibility stage, the Engagement Insights CTA is clickable to open a drawer with detailed metrics on the selected actions:
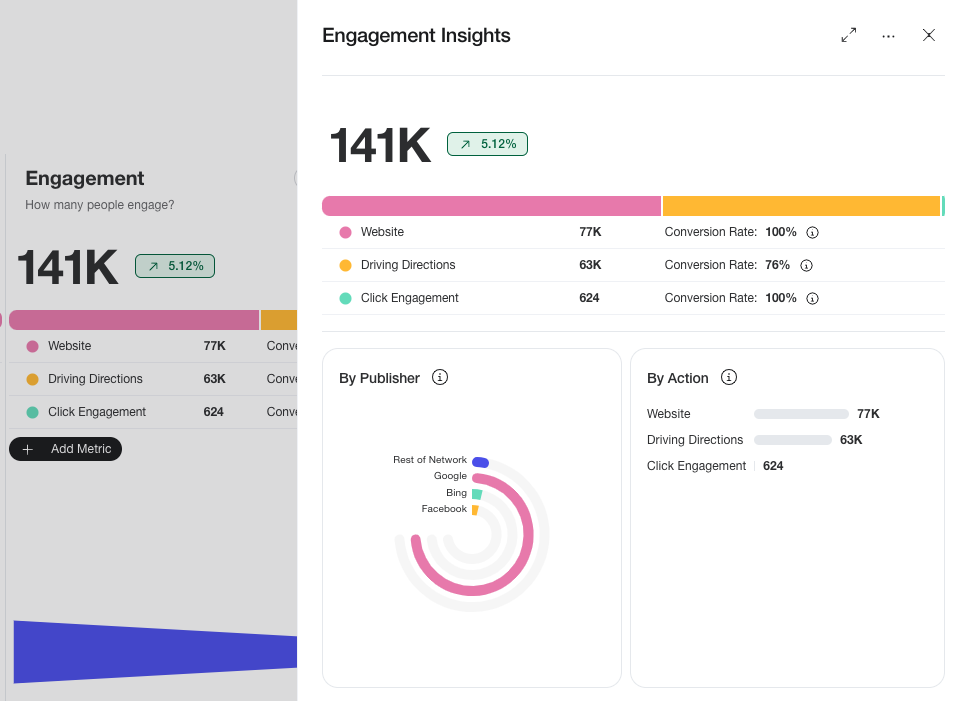
- The change compared to the previous time period is indicated by the icon next to the Engagement hero metric.
- By Publisher: View a breakdown of the total actions attributed to Google (Maps and Search), Facebook, and the rest of the Publisher Network. Hover over each ring for an exact number.
- By Action: See total numbers for the selected actions.
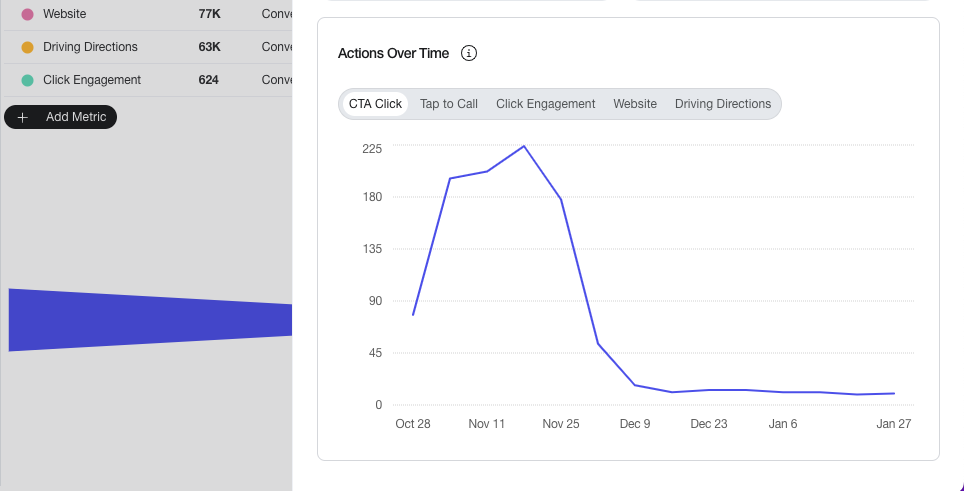
- Actions Over Time: See the change in each selected action metric over the selected time period.
Estimated Conversions
The Estimated Conversions stage of the funnel calculates the estimated revenue from the selected actions in the Engagement stage.
Conversions are grouped into four types:
- Content Engagement: Action that indicates interest in information ahead of making a purchase. Includes general interaction with content such as promotional messages, products, menus or liking a business page.
- Digital Lead: Action that expresses interest in initiating contact with a business. Includes clicks to Apply Now and Order Now CTAs, as well as clicking to call or email.
- In-Store Visit: Action that indicates intent to visit a physical location, or confirms a physical visit if supported by the platform. Includes using Driving Directions and check-in engagement.
- Online Visit: Action that indicates intent to visit the business’s website or leads to more information on the business page.
See the Engagement and Conversion Metrics section for a breakdown of the engagement actions that correspond to each conersion type.
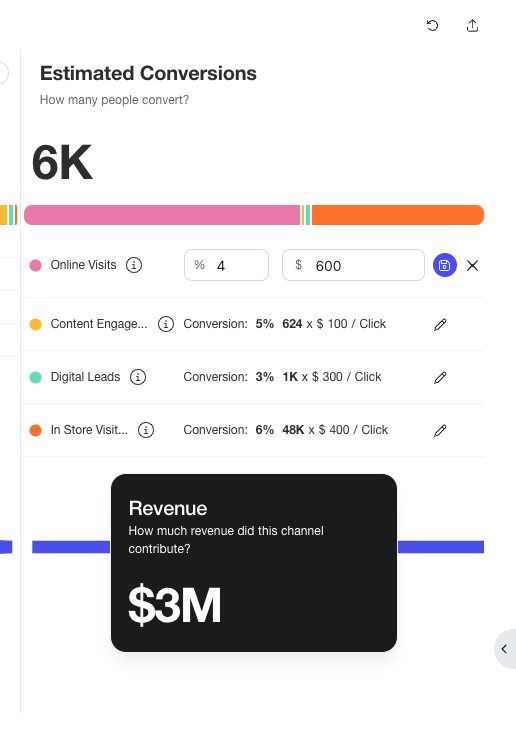
Click the pencil icon beside each conversion type to change the inputs to calculate the estimated dollar amount. Input the desired conversion rate and estimated revenue based on your business goals.
Engagement and Conversion Metrics
Below is a breakdown of all the available engagement actions that can be added to the Engagement stage of the funnel, the metric that determines whether or not the action is a conversion, and the corresponding conversion type in the Estimated Conversions stage of the funnel.
| Engagement Action | Action API Name | Conversion Metric | Conversion Type |
|---|---|---|---|
| Apply Now | APPLY_NOW |
Lead | Digital Lead |
| Book Appointment | BOOK_APPOINTMENT |
Visit | In-store Visit |
| Checkin Engagement | CHECKIN_ENGAGEMENT |
Purchase | In-store Visit |
| Click Engagement | CLICK_ENGAGEMENT |
Click | Content Engagement |
| Collapse Click | COLLAPSE_CLICK |
Click | Content Engagement |
| CTA Click | CTA_CLICK |
Click | Digital Lead |
| Driving Directions | DRIVING_DIRECTIONS |
Visit | In-store Visit |
| Event Engagement | EVENT_ENGAGEMENT |
Click | Content Engagement |
| Expand Click | EXPAND_CLICK |
Click | Content Engagement |
| Featured Message Engagement | FEATURED_MESSAGE_ENGAGEMENT |
Click | Content Engagement |
| Menu | MENU |
Lead | Digital Lead |
| Message | MESSAGE |
Lead | Digital Lead |
| Order Now | ORDER_NOW |
Lead | Digital Lead |
| Page Click | PAGE_CLICK |
Purchase | Online Visit |
| Page Like | PAGE_LIKE |
Click | Content Engagement |
| Product Engagement | PRODUCT_ENGAGEMENT |
Click | Content Engagement |
| Tap to Call | TAP_TO_CALL |
Lead | Digital Lead |
| Tap to Email | TAP_TO_EMAIL |
Lead | Digital Lead |
| Thumbs Down | THUMBS_DOWN |
Click | Content Engagement |
| Thumbs Up | THUMBS_UP |
Click | Content Engagement |
| Title Click | TITLE_CLICK |
Click | Content Engagement |
| Website | WEBSITE |
Purchase | Online Visit |
Visibility
The Visibility tab displays reports on key metrics for your locations. You can use the filter options at the top of the page to filter the reports by keywords and timeframe. You can also use the Advanced filter options to filter by any other entity criteria (such as region, name, etc.)
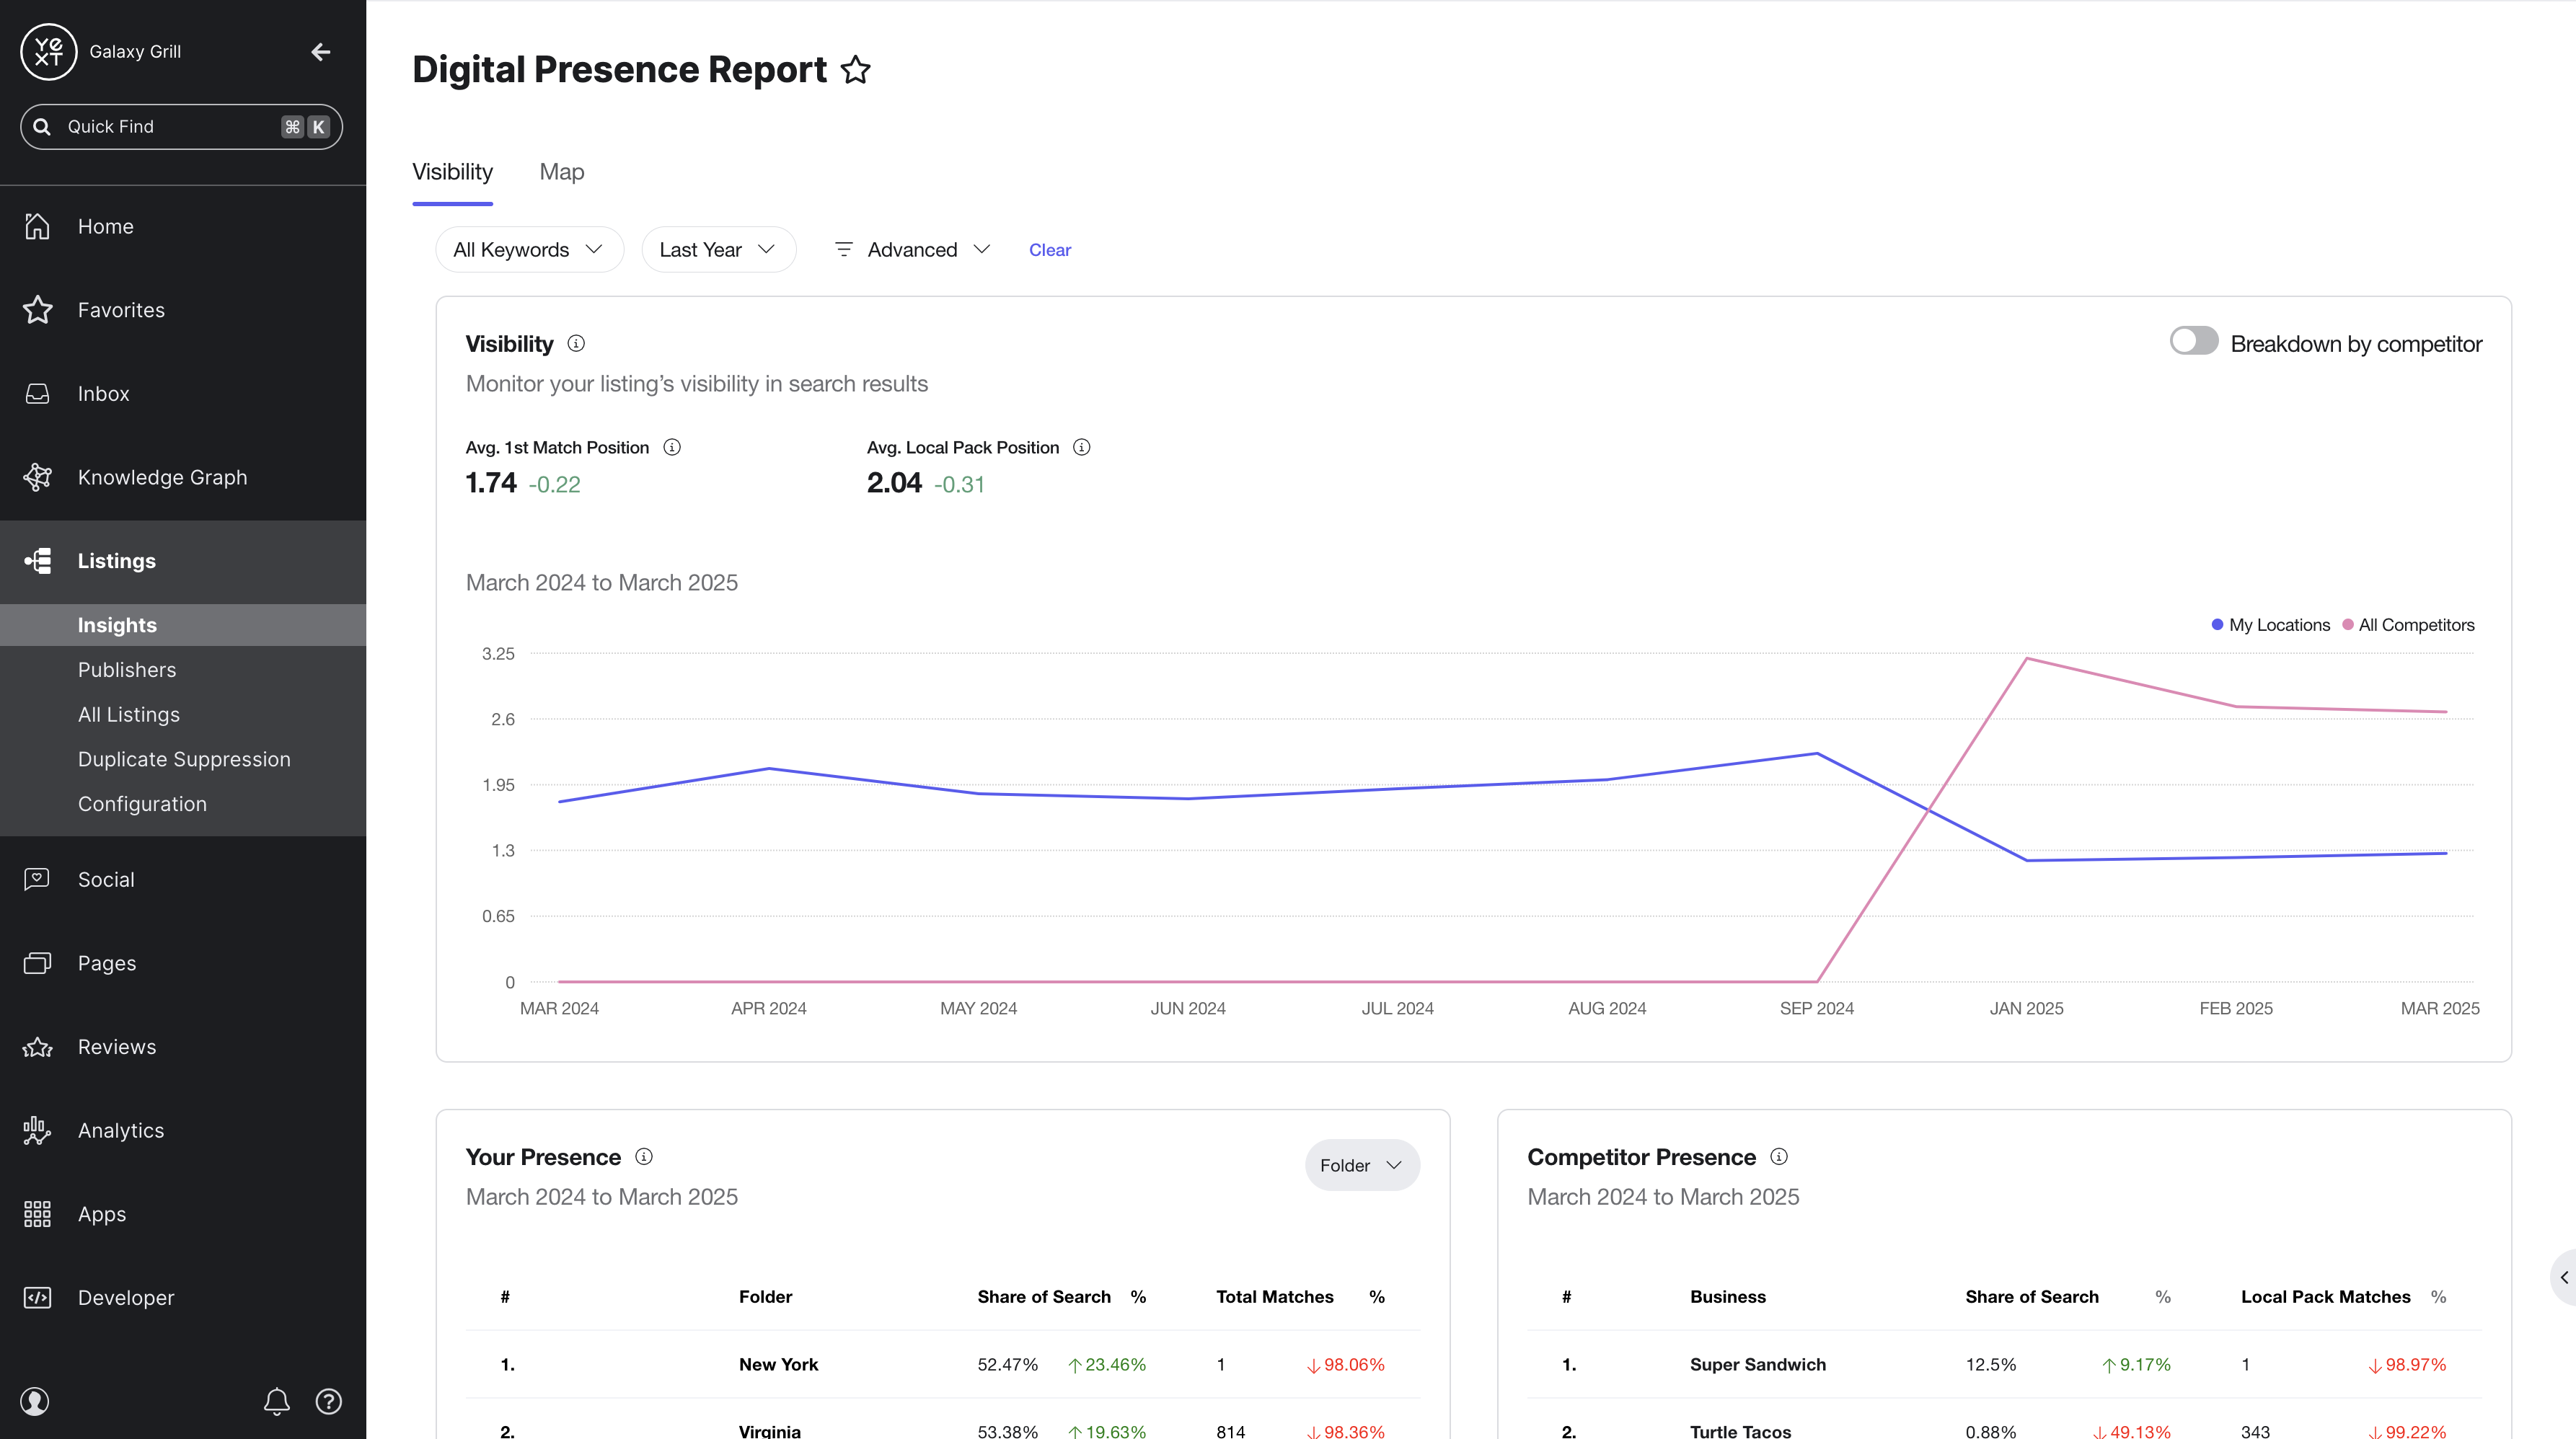
The reports here include your selected locations’ visibility in search results over time, your presence in search compared to the total search volume in your category, your search presence compared to competitors, and your locations’ performance in search for your chosen keywords.
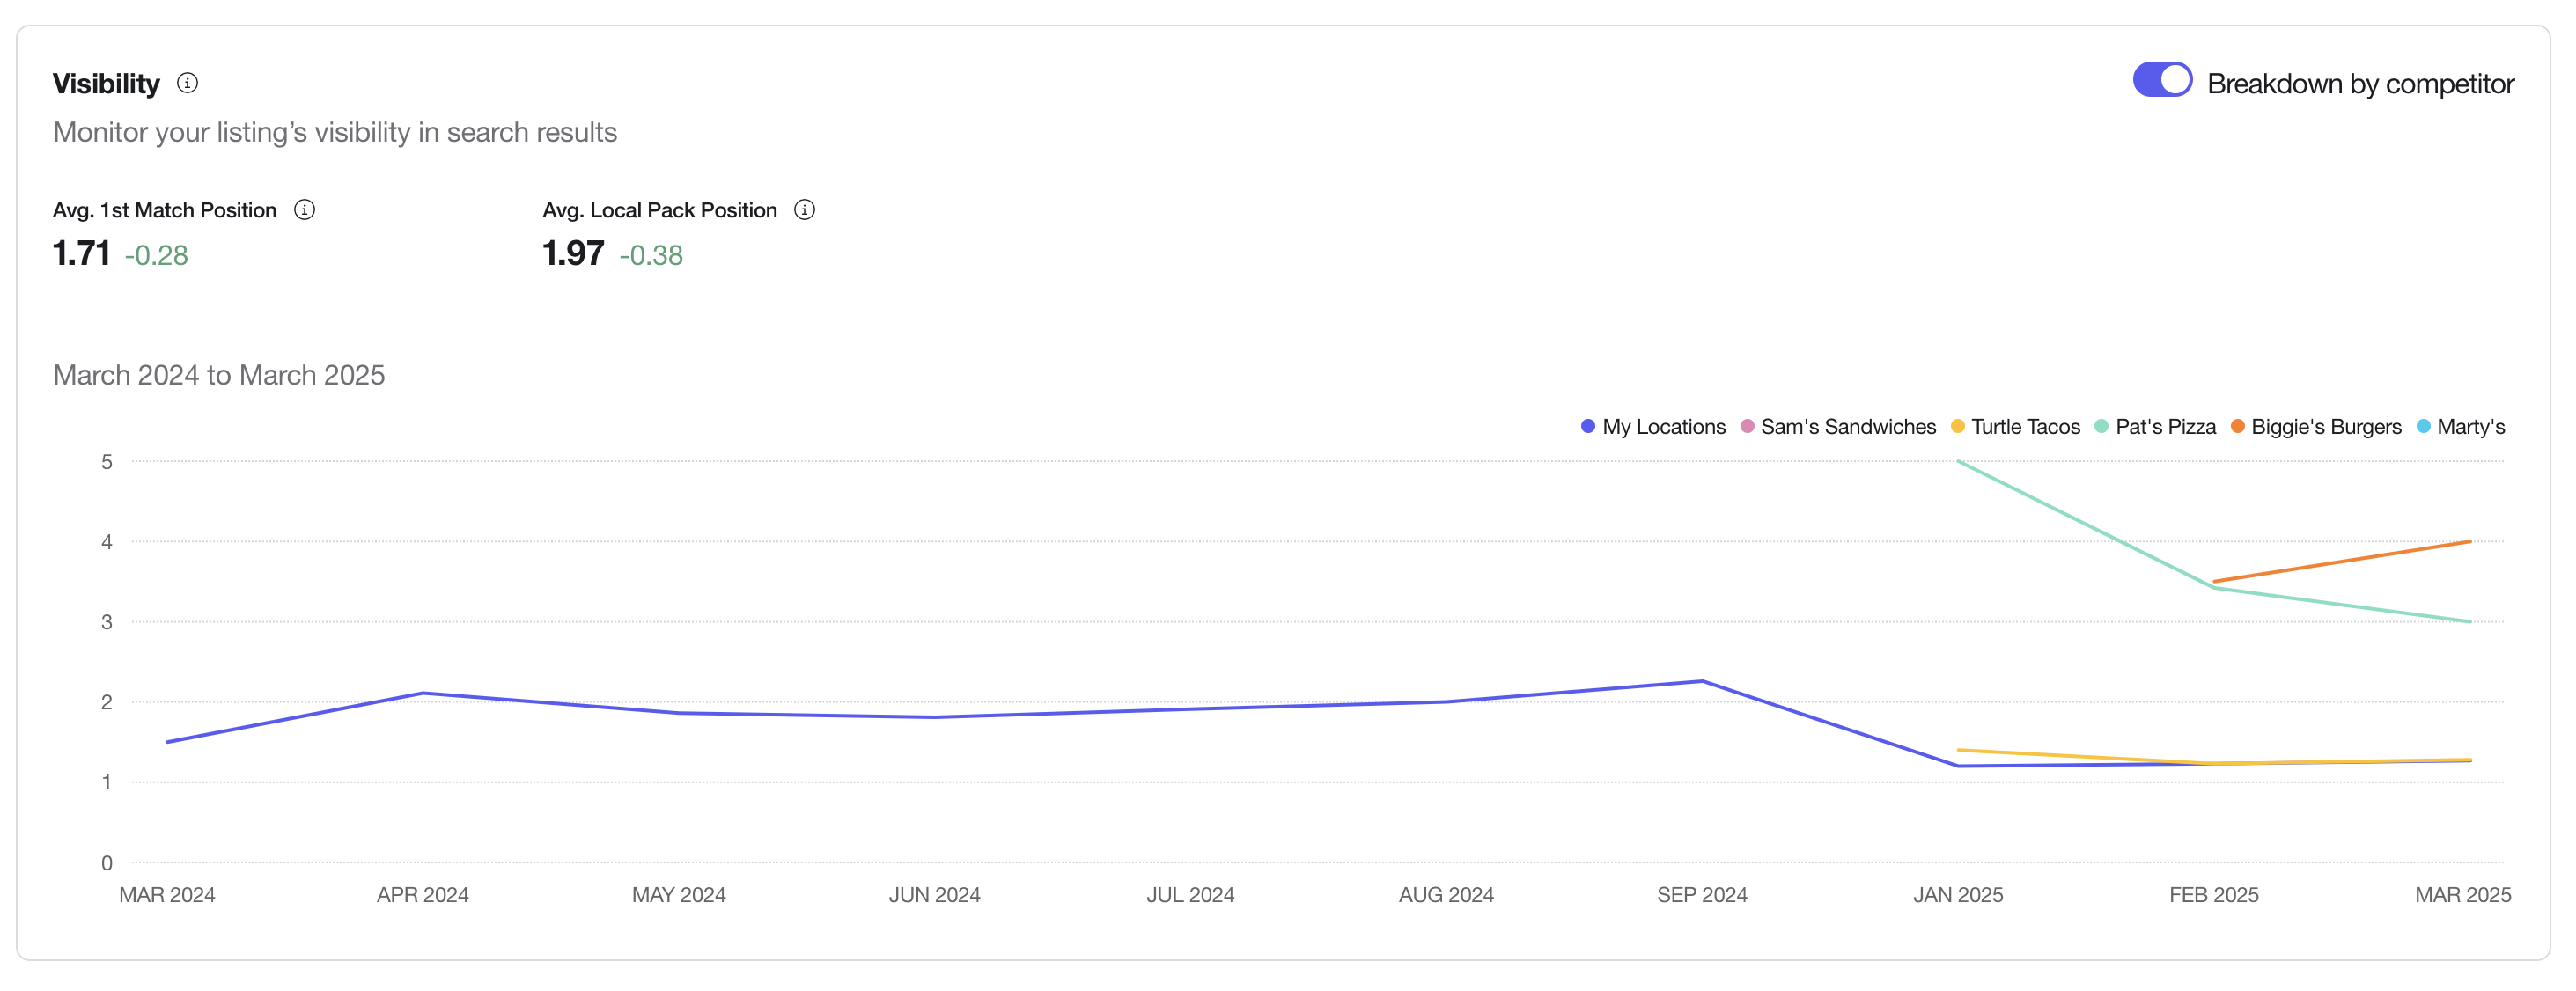
Visibility
This report combines three metrics to provide a holistic view of how your locations are performing in search over time:
- Share of Intelligent Search: the overall likelihood of one of your locations being clicked in search results, based on the type of search result and the position on the results page. This is the main line on the graph.
- Average First Match Position: on average, where the first result for one of your tracked locations appears on a search results page
- Average Local Pack Position: on average, where results for your tracked locations appear within the local pack results
You can also use the Breakdown by competitor toggle to compare your Share of Intelligent Search metric with individual competitors that you listed during Search Tracker setup. If this toggle is not selected, all competitor data will be compiled into an average.
Your Presence
This report uses the Share of Intelligent Search and Total Matches metrics (with a percentage of how each has changed in the selected timeframe) to show how your locations are performing in search compared to the total search opportunity in your category.
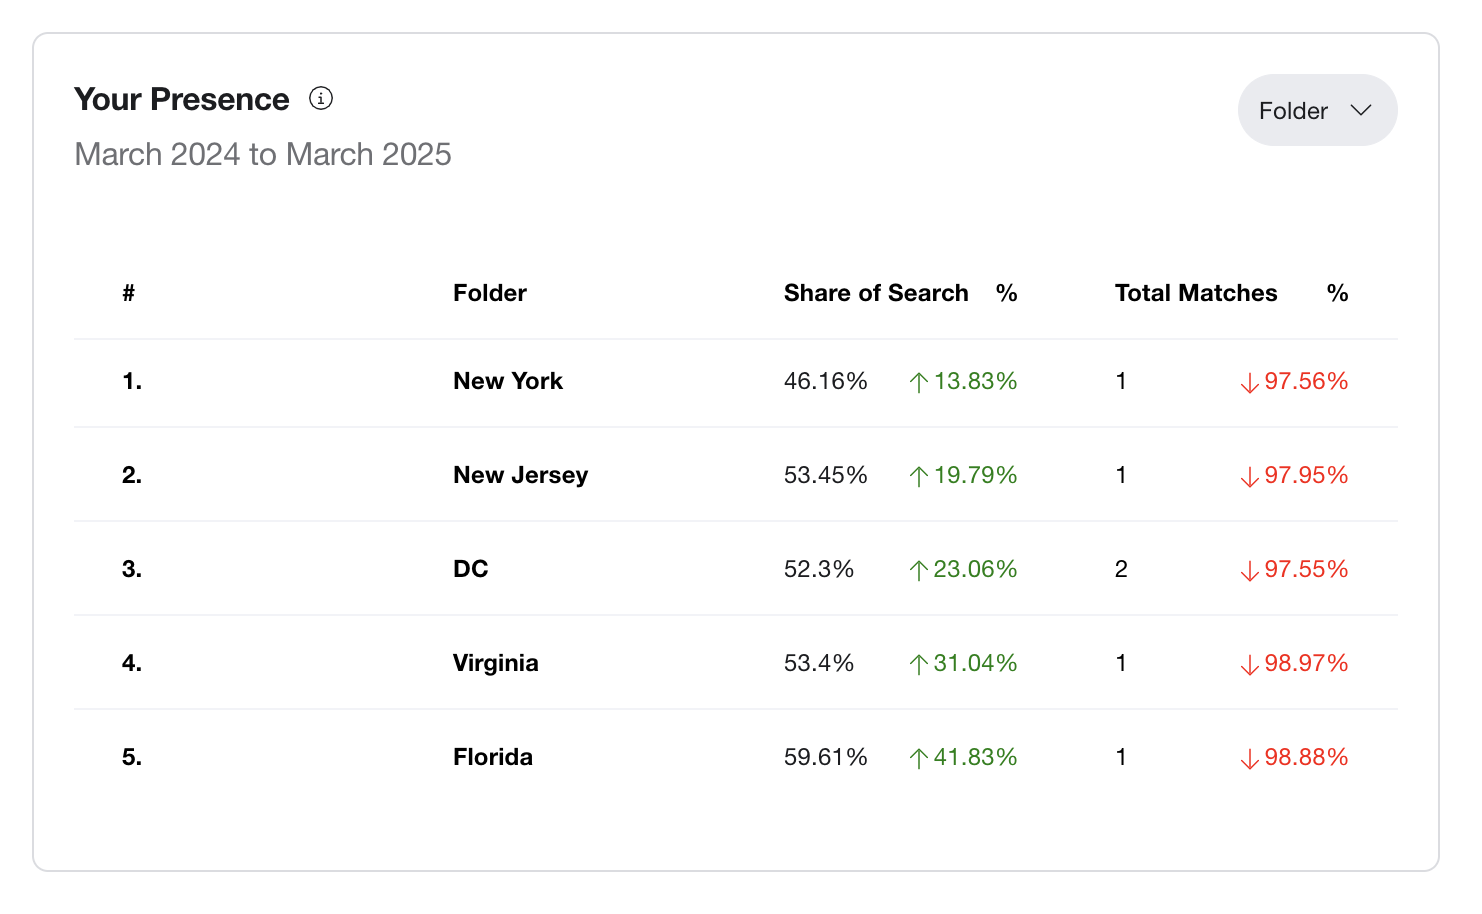
By default, this report groups your locations by folder. Use the dropdown in the top right of the report to group your locations by Label, State, or display by individual Entity.
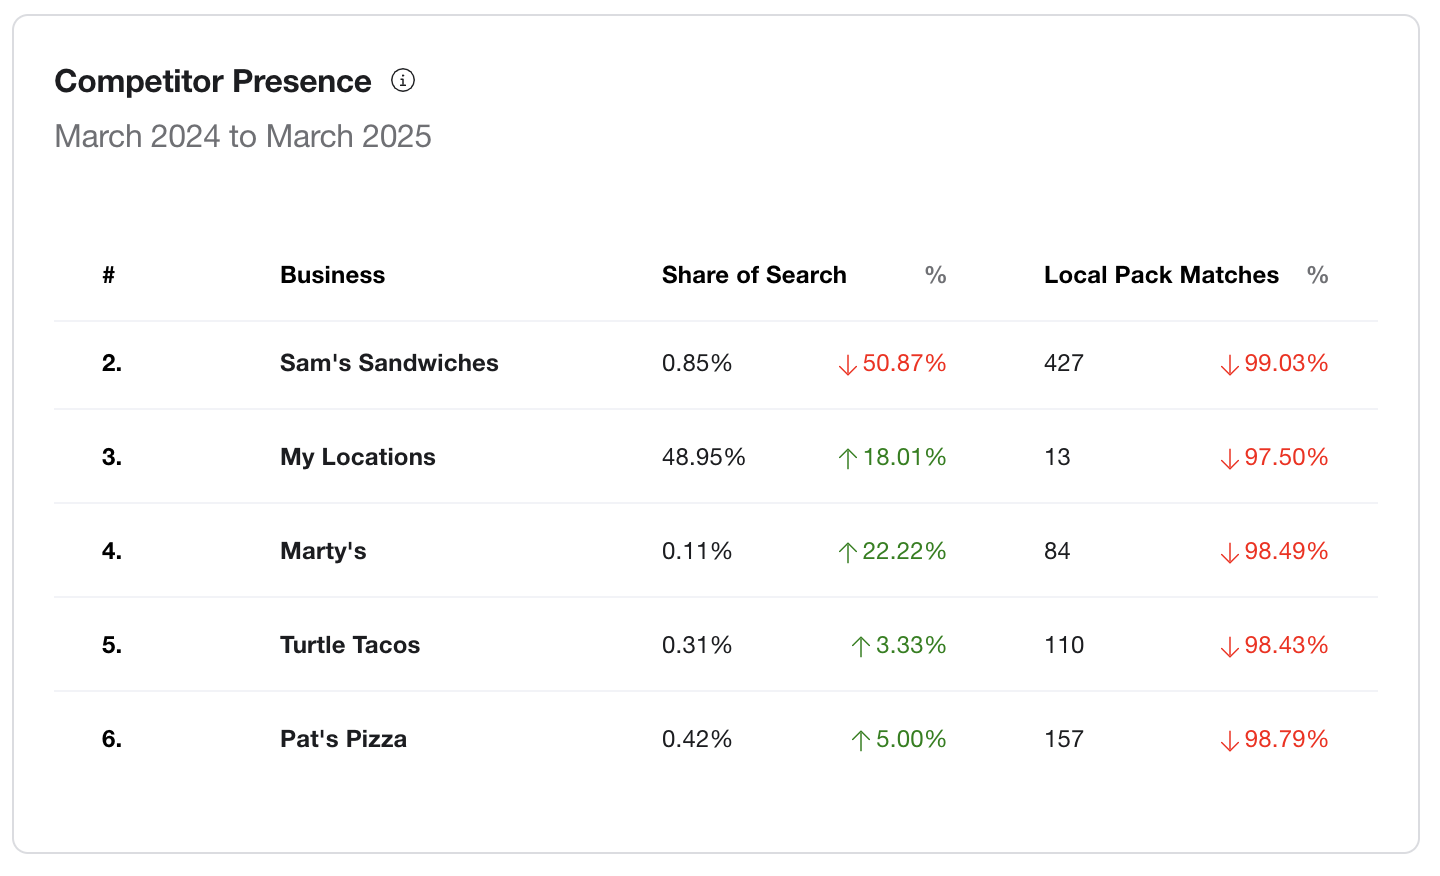
Competitor Presence
This report uses Share of Intelligent Search and Total Matches filtered to only local pack results, to compare your presence to your chosen competitors for the specified timeframe. This report looks at all your tracked locations in aggregate.
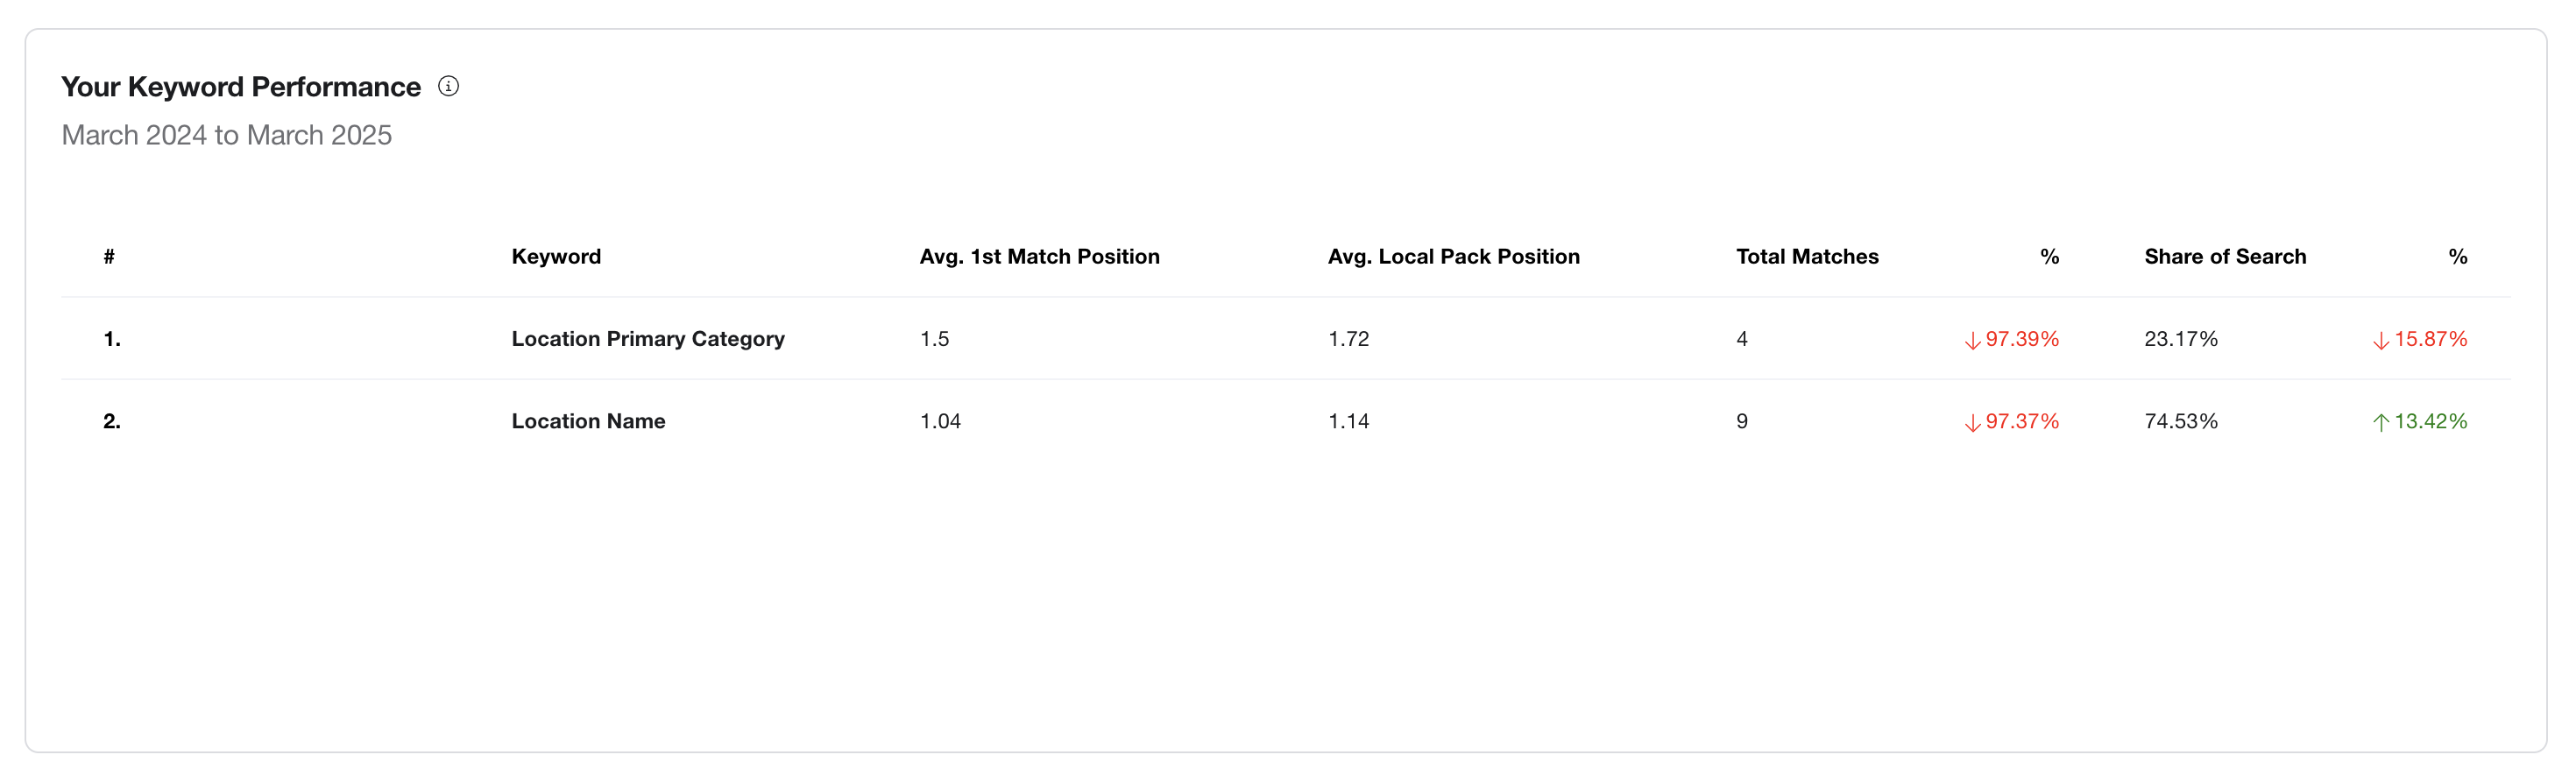
Your Keyword Performance
This report displays the performance of your chosen tracked keywords, based on these metrics:
Map
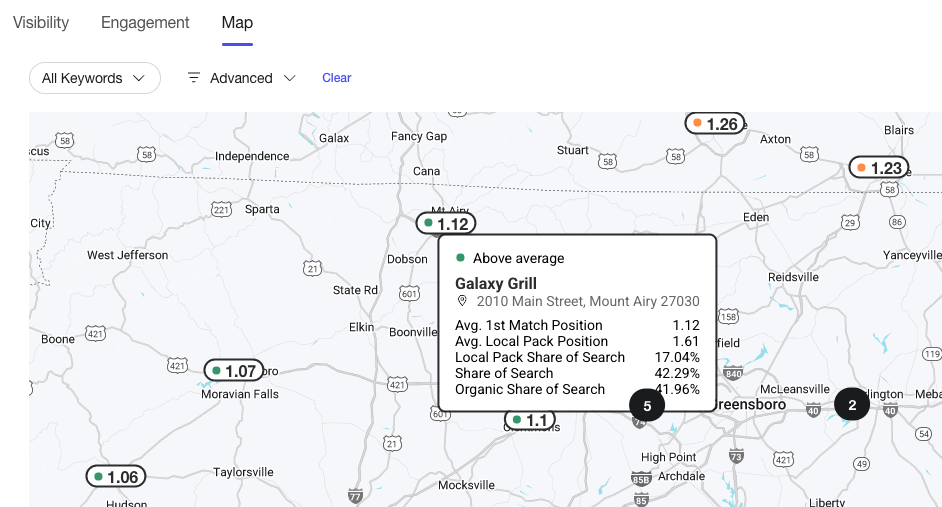
The Map tab of Listings Insights displays search data about your tracked locations in a visual and interactive map. You can narrow the results by filtering for keywords and advanced entity criteria.
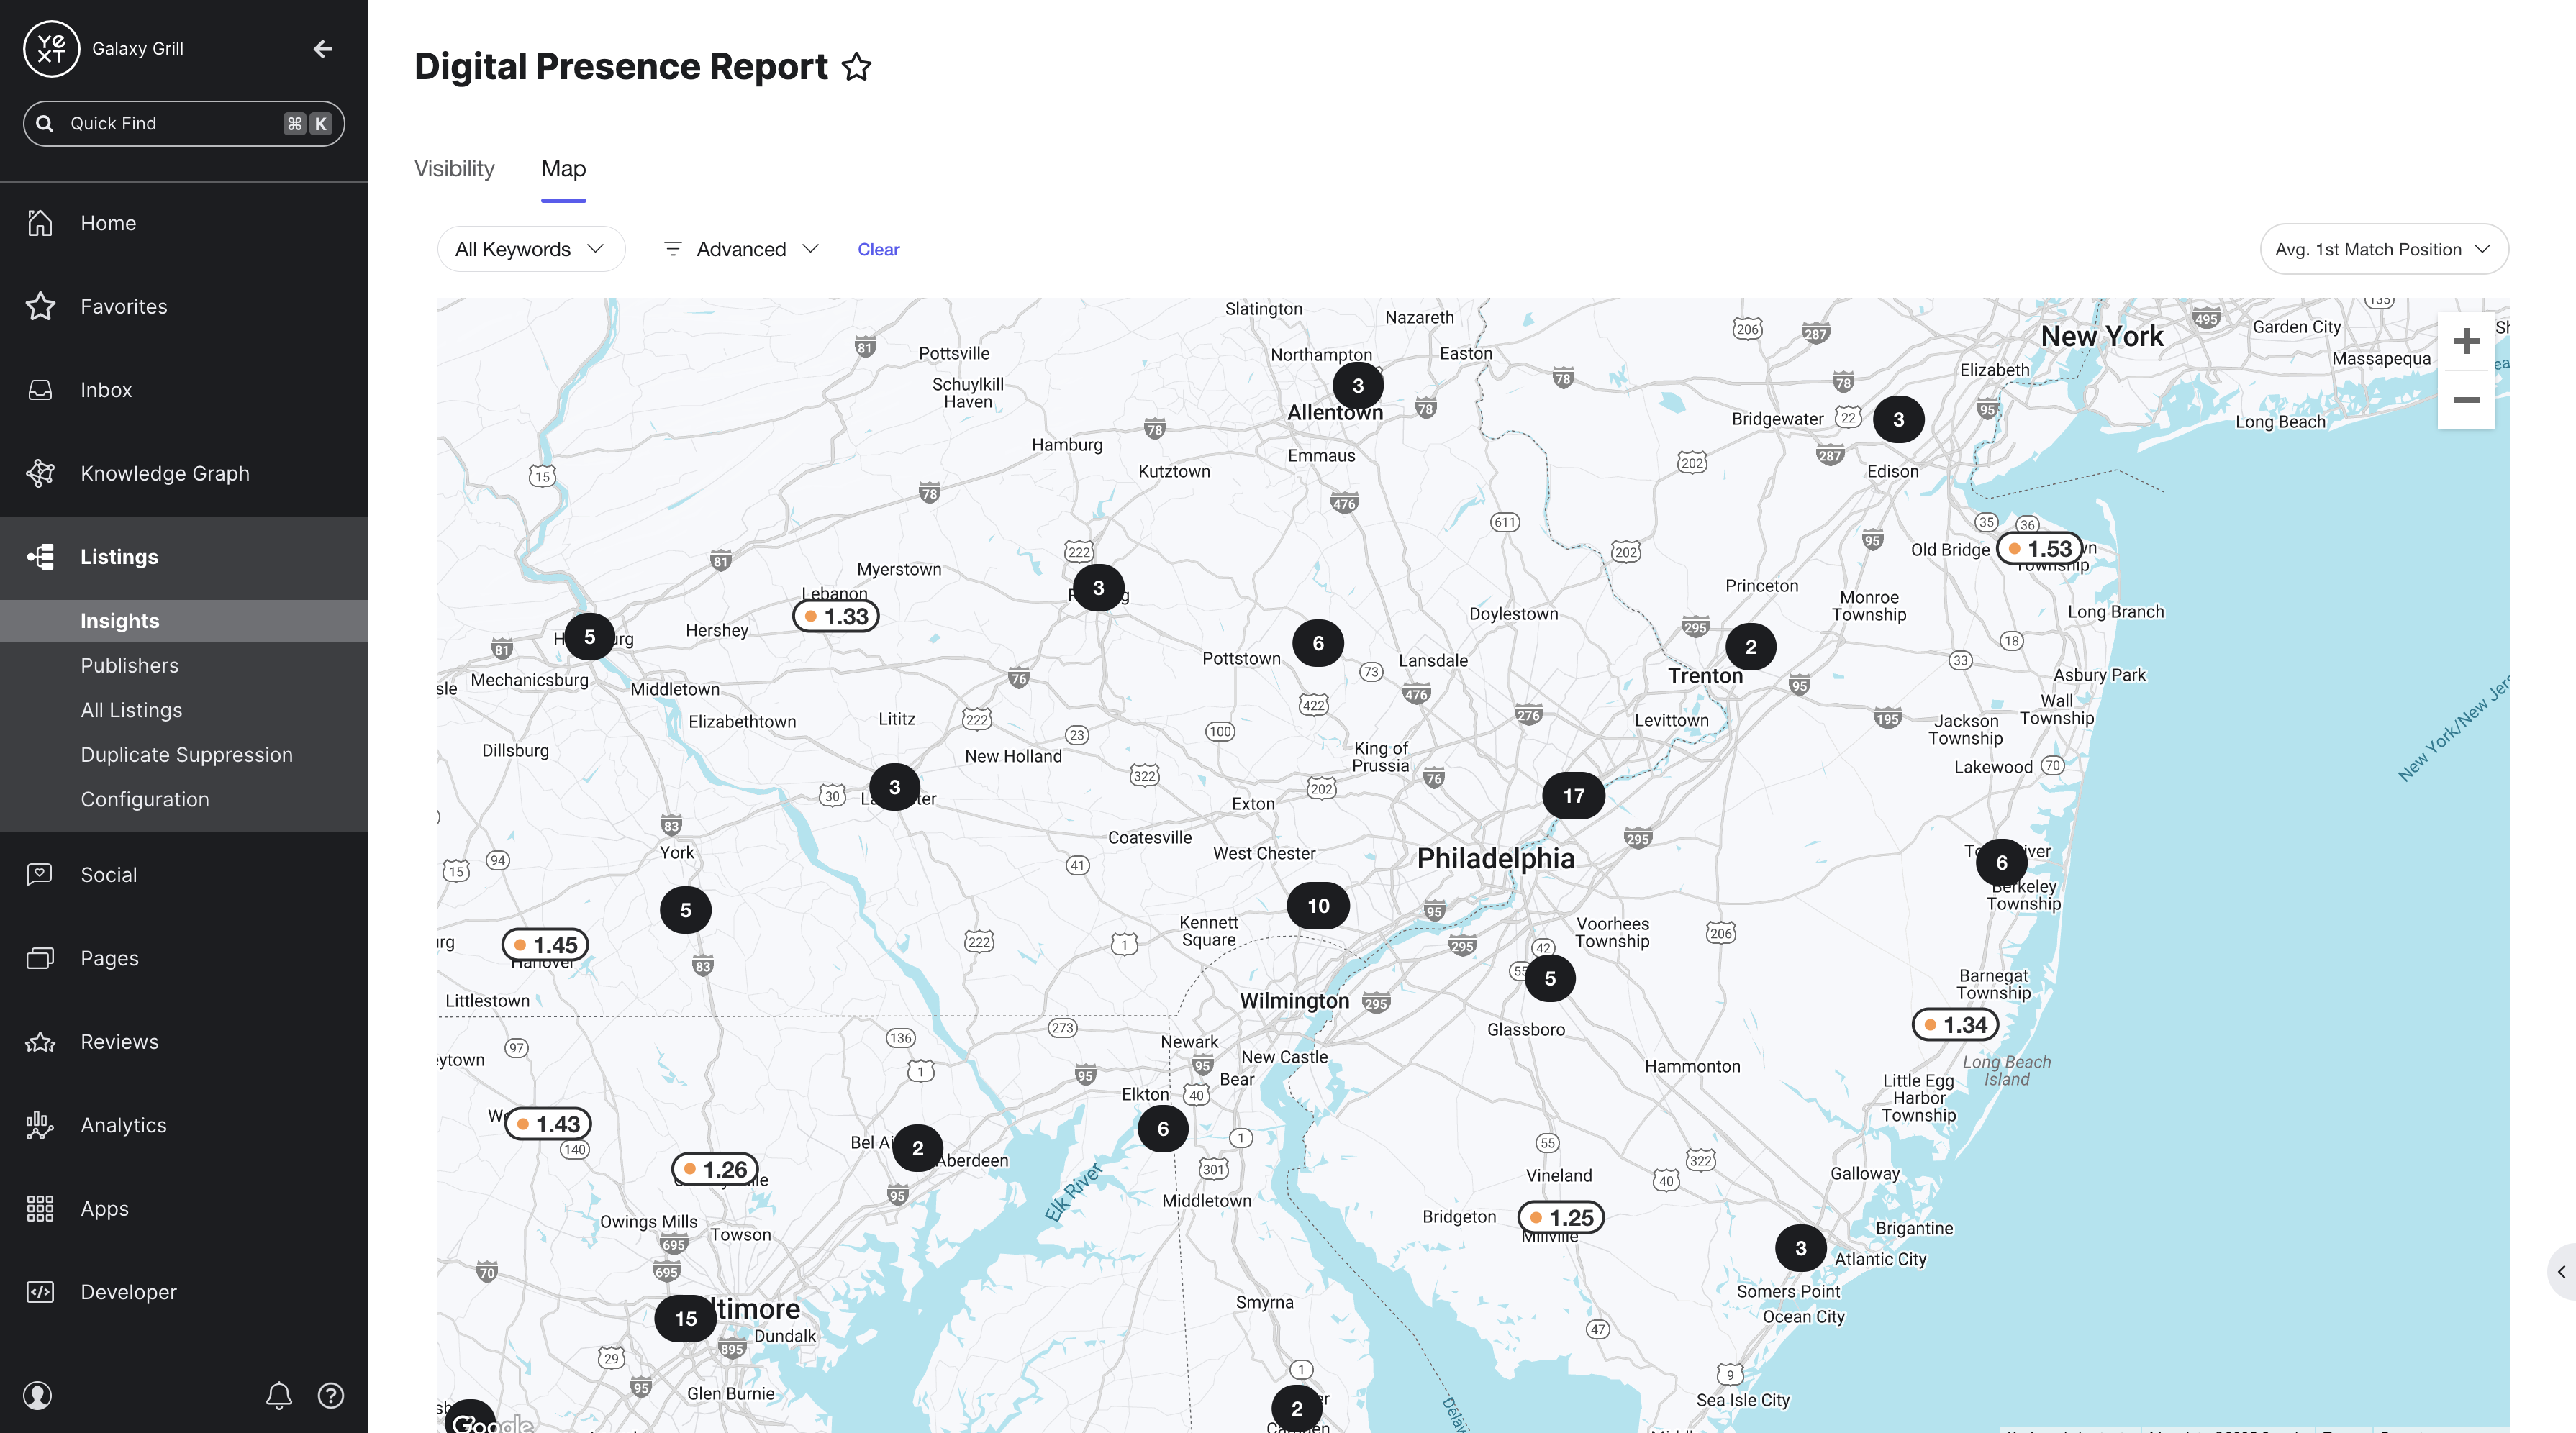
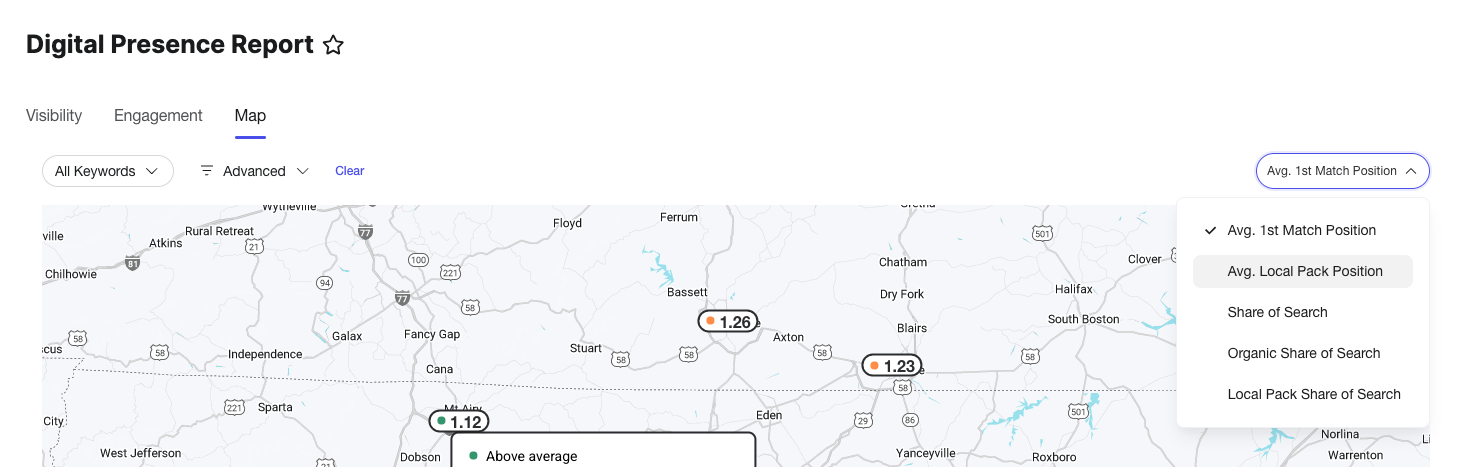
View your locations on the map by different search metrics by choosing from the dropdown menu in the upper right of the map. Choose to display your locations based on one of these metrics:
- Average First Match Position
- Average Local Pack Position
- Share of Intelligent Search
- Organic Share of Search
- Local Pack Share of Search
Each icon on the map represents one of your tracked locations, with data to indicate on how well the location is performing based on your chosen metric. Hover over each location to see expanded information and data on the other available metrics.